| Date | May 2017 | Marks available | 2 | Reference code | 17M.1.AHL.TZ1.H_10 |
| Level | Additional Higher Level | Paper | Paper 1 | Time zone | Time zone 1 |
| Command term | Calculate | Question number | H_10 | Adapted from | N/A |
Question
The continuous random variable X has a probability density function given by
.
Find the value of .
By considering the graph of f write down the mean of ;
By considering the graph of f write down the median of ;
By considering the graph of f write down the mode of .
Show that .
Hence state the interquartile range of .
Calculate .
Markscheme
* This question is from an exam for a previous syllabus, and may contain minor differences in marking or structure.
attempt to equate integral to 1 (may appear later) M1
correct integral A1
substituting limits M1
A1
[4 marks]
mean A1
Note: Award A1A0A0 for three equal answers in .
[1 mark]
median A1
Note: Award A1A0A0 for three equal answers in .
[1 mark]
mode A1
Note: Award A1A0A0 for three equal answers in .
[1 mark]
M1
A1
Note: Accept without the at this stage if it is added later.
M1
AG
[4 marks]
from (c)(i) (A1)
as the graph is symmetrical about the middle value (A1)
so interquartile range is
A1
[3 marks]
(M1)
A1
[2 marks]
Examiners report
Syllabus sections
-
19M.1.SL.TZ1.T_7b:
In the table indicate which two of the given statements are true by placing a tick (✔) in the right hand column.

-
18M.2.SL.TZ2.T_1a.i:
Write down the value of a.
-
22M.1.SL.TZ1.10a:
Complete the tree diagram.

-
19M.2.AHL.TZ1.H_9a.ii:
only a sandwich.
-
18N.1.AHL.TZ0.H_1a:
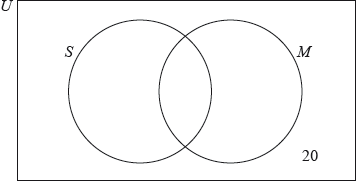
By drawing a Venn diagram, or otherwise, find .
-
18N.2.SL.TZ0.T_2a.i:
Find the number of students in the school that are taught in Spanish.
-
19M.1.SL.TZ2.T_5a:
Using the given information, complete the following Venn diagram.

-
18N.2.AHL.TZ0.H_10b.ii:
an estimate for the standard deviation of the number of emails received per working day.
-
18M.1.SL.TZ2.S_8a:
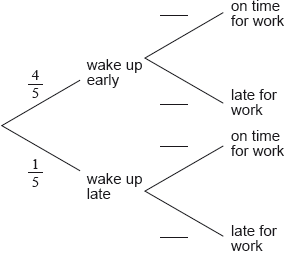
Copy and complete the following tree diagram.

-
18M.1.SL.TZ1.T_10a:
Complete the Venn diagram using the given information.

-
17M.1.SL.TZ2.T_2b:
Complete the Venn diagram using the above information.

-
17N.2.SL.TZ0.T_4c:
Copy and complete the tree diagram.
-
18N.1.SL.TZ0.T_8a:
Complete the tree diagram.

-
18M.1.SL.TZ2.T_9a.i:
Write down an expression, in set notation, for the shaded region represented by Diagram 1.
-
18M.2.SL.TZ1.S_9a:
Find the probability that an orange weighs between 289 g and 310 g.
-
19M.1.SL.TZ1.T_7a:
Place the numbers and in the correct position on the Venn diagram.

-
18M.1.SL.TZ2.T_9b.i:
Shade, on the Venn diagram, the region represented by the set .

-
19M.1.SL.TZ1.T_5a:
Complete the cumulative frequency table.
-
19M.2.SL.TZ2.T_1a:
Write down the null hypothesis, H0 , for this test.
-
19N.1.SL.TZ0.T_4a:
Write down .
-
18M.2.SL.TZ1.T_2g:
Given that this flight was not heavily delayed, find the probability that it travelled between 500 km and 5000 km.
-
18N.2.AHL.TZ0.H_10d:
Suppose that the probability of Archie receiving more than 10 emails in total on any one day is 0.99. Find the value of λ.
-
18N.1.AHL.TZ0.H_1b:
Show that the events and are not independent.
-
22M.1.AHL.TZ2.12c:
Find the probability of making an error using the zoologist’s method.
-
EXN.1.AHL.TZ0.6c:
Find the probability it will rain at least once while Paula is outside.
-
EXN.1.SL.TZ0.10b:
Find the probability it will rain in each of the three hours Paula is working outside.
-
19M.1.SL.TZ2.T_11b.ii:
Write down .
-
17N.2.SL.TZ0.T_4f:
Find the probability that the tested adult is allergic to nuts given that the liquid turned blue.
-
17M.1.SL.TZ1.S_1b:
A girl is selected at random. Find the probability that she takes economics but not history.
-
18M.2.SL.TZ2.T_1a.ii:
Write down the value of b.
-
21M.2.SL.TZ2.1b.i:
.
-
21N.1.SL.TZ0.11a:
Write down the value of .
-
21N.1.SL.TZ0.11b:
Find an expression, in terms of , for the probability of a person not having blue eyes and having fair hair.
-
22M.1.SL.TZ2.2c:
Two different applicants are chosen at random from the original group.
Find the probability that both applicants applied to the Arts programme.
-
22M.1.SL.TZ2.2a:
Find the probability that a randomly chosen applicant from this group was accepted by the university.
-
22M.1.SL.TZ2.2b:
Find the probability that the applicant applied for the Arts programme.
-
22M.3.AHL.TZ2.2h:
Show that Jonas’s network satisfies the requirement of there being less than a probability of the network failing after a power surge.
-
21N.1.SL.TZ0.11c.i:
.
-
21N.2.AHL.TZ0.3b:
Find the probability that Arianne throws two consecutive darts that land more than from .
-
22M.1.SL.TZ1.10b:
Find the probability that Karl takes two socks of the same colour.
-
22M.1.SL.TZ1.10c:
Given that Karl has two socks of the same colour find the probability that he has two brown socks.
-
21N.1.SL.TZ0.11c.ii:
.
-
21N.2.SL.TZ0.1b:
State the null and alternative hypotheses.
-
21N.2.SL.TZ0.5b:
Find the probability that Arianne throws two consecutive darts that land more than from .
-
18N.2.AHL.TZ0.H_10a.ii:
Using this distribution model, find the standard deviation of .
-
18N.2.AHL.TZ0.H_10b.i:
an estimate for the mean number of emails received per working day.
-
19M.2.AHL.TZ2.H_3a:
Complete the given probability tree diagram for Iqbal’s three attempts, labelling each branch with the correct probability.

-
19M.2.AHL.TZ1.H_9c.i:
A customer is selected at random. Find the probability that the customer is male and buys a sandwich.
-
17M.1.AHL.TZ1.H_10a:
Find the value of .
-
17M.1.AHL.TZ1.H_10b.i:
By considering the graph of f write down the mean of ;
-
16N.2.SL.TZ0.T_6b:
Express this volume in .
-
18M.2.SL.TZ1.T_5e:
120 contestants attempted this game.
Find the expected number of contestants who fell into a trap while attempting to pass through a door in the third wall.
-
17M.1.SL.TZ1.T_4b:
Determine whether rock-climbing is offered by the school in the fall/autumn trimester.
-
16N.2.SL.TZ0.T_2c:
Write down the value of .
-
18N.2.SL.TZ0.T_2a.ii:
Find the number of students in the school that study Mathematics in English.
-
19M.1.SL.TZ2.T_5b:
Find the number of surveyed students who did not like any of the three flavours.
-
17M.2.SL.TZ2.S_10b.i:
Write down the probability of drawing three blue marbles.
-
18N.2.SL.TZ0.S_9c:
A randomly selected participant has a reaction time greater than 0.65 seconds. Find the probability that the participant is in Group X.
-
18M.2.SL.TZ1.T_2d.ii:
Write down the associated p-value.
-
18M.2.SL.TZ2.T_1c.i:
Find the value of x.
-
18M.2.SL.TZ2.T_1c.ii:
Find the value of y.
-
17M.1.SL.TZ2.T_2d:
Write down the value of .
-
17M.1.SL.TZ2.T_10a:
Write down the probability that a light bulb produced by Home Shine is not defective.
-
17M.1.SL.TZ1.T_7a:
Complete the tree diagram.
-
18N.1.SL.TZ0.T_14b:
Find the probability that a randomly chosen student will be accepted by Marron College.
-
19M.2.AHL.TZ1.H_9a.i:
both a sandwich and a cake.
-
19M.1.SL.TZ1.T_5b:
Write down the probability that a bouquet of roses sold is not small.
-
17M.1.SL.TZ1.S_1a.i:
Find the value of ;
-
19M.1.SL.TZ2.T_11a:
Write down the elements that belong to .
-
18M.2.SL.TZ2.T_1d:
Find the number of employees who, in the last year, did not travel to work by car, bicycle or public transportation.
-
18M.1.SL.TZ2.T_7a:
State the number of boys who answered questions in Portuguese.
-
SPM.1.SL.TZ0.12a:
Find the exact value of .
-
19M.2.AHL.TZ1.H_9b.ii:
Find the probability that more than 100 cakes will be sold on a typical day.
-
19N.2.SL.TZ0.T_1d.ii:
the -value.
-
19M.2.SL.TZ2.S_9a:
Show that event A and event D are not independent.
-
19M.2.SL.TZ1.S_10c.i:
Write down the value of .
-
18M.2.SL.TZ1.T_2d.i:
Write down the χ2 statistic.
-
19M.2.SL.TZ1.S_10c.ii:
Hence, find the value of .
-
18M.2.SL.TZ1.T_5c:
Copy the probability tree diagram and write down the relevant probabilities along the branches.
-
19M.2.SL.TZ2.T_1b:
State the number of degrees of freedom.
-
19M.2.SL.TZ2.T_1c.i:
the expected frequency of female students who chose to take the Chinese class.
-
19M.2.SL.TZ2.T_1d:
State whether or not H0 should be rejected. Justify your statement.
-
17N.2.SL.TZ0.S_4b:
Write down .
-
19M.2.SL.TZ2.S_9b.ii:
Given that all passengers for a flight arrive on time, find the probability that the flight does not depart on time.
-
18M.2.SL.TZ1.T_2a:
State the alternative hypothesis.
-
18M.1.SL.TZ2.T_9b.ii:
Shade, on the Venn diagram, the region represented by the set .

-
17N.2.SL.TZ0.T_4d:
Find the probability that this adult is allergic to nuts and the liquid turns blue.
-
18M.2.SL.TZ1.T_2c:
Write down the number of degrees of freedom.
-
18M.1.SL.TZ2.S_8d:
Given that Pablo is late for work, find the probability that he left home before 07:00.
-
17M.2.SL.TZ1.S_9d:
Given that , find .
-
18N.2.AHL.TZ0.H_10a.i:
Using this distribution model, find .
-
19M.1.SL.TZ1.S_1b:
Find the value of .
-
19M.1.SL.TZ1.S_1c:
Find .
-
19M.1.SL.TZ1.T_12c:
Write down the probability that the second spin is yellow, given that the first spin is blue.
-
18M.2.SL.TZ1.S_9c:
To the nearest gram, find the minimum weight of an orange that the grocer will buy.
-
17M.1.SL.TZ1.T_4a:
Write down the number of sporting activities offered by the school during its school year.
-
18M.2.SL.TZ2.T_1e:
Find .
-
18M.1.SL.TZ2.S_8b:
Find the probability that Pablo leaves home before 07:00 and is late for work.
-
19M.2.AHL.TZ1.H_9b.i:
Find the expected number of cakes sold on a typical day.
-
18N.1.SL.TZ0.S_9c:
Hayley plays the game when = 5. She pays $20 to play and can earn money back depending on the number of draws it takes to obtain a blue marble. She earns no money back if she obtains a blue marble on her first draw. Let M be the amount of money that she earns back playing the game. This information is shown in the following table.

Find the value of so that this is a fair game.
-
18N.2.SL.TZ0.T_2c.i:
Find the probability that this student studies Mathematics.
-
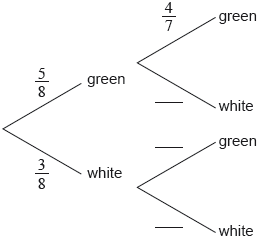
17N.1.SL.TZ0.S_1b:
Find the probability that exactly one of the selected balls is green.
-
17M.2.SL.TZ1.S_9c:
Find .
-
16N.1.SL.TZ0.T_12b:
Find the value of .
-
16N.1.SL.TZ0.T_3a:
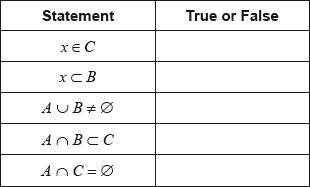
In the table indicate whether the given statements are True or False.
-
19N.2.SL.TZ0.T_1d.i:
the statistic.
-
19N.2.SL.TZ0.T_1b:
Write down the number of degrees of freedom.
-
19N.2.SL.TZ0.T_1a:
State , the null hypothesis for this test.
-
18N.2.AHL.TZ0.H_10e:
Now suppose that Archie received exactly 20 emails in total in a consecutive two day period. Show that the probability that he received exactly 10 of them on the first day is independent of λ.
-
19N.1.SL.TZ0.T_4c:
Write down an element that belongs to .
-
19M.1.SL.TZ1.S_9d:
It is also known that P( > 2) = .
Find .
-
19M.2.SL.TZ1.S_10a.ii:
Find the probability of rolling two or more red faces.
-
19N.1.SL.TZ0.T_4b:
Complete the following Venn diagram using all elements of .

-
19M.2.SL.TZ1.S_10a.i:
Find the probability of rolling exactly one red face.
-
19M.1.SL.TZ1.T_5c:
A customer buys a large bouquet.
Find the probability that there are 12 roses in this bouquet.
-
18N.2.SL.TZ0.T_2a.iii:
Find the number of students in the school that study both Biology and Mathematics.
-
17N.2.SL.TZ0.T_4g:
Estimate the number of employees, from this 38, who are allergic to nuts.
-
18M.1.SL.TZ2.S_8c:
Find the probability that Pablo is late for work.
-
17N.1.SL.TZ0.S_1a:
Complete the following tree diagram.
-
17M.1.SL.TZ1.T_4c.i:
Write down the elements of the set ;
-
18N.2.AHL.TZ0.H_10c:
Give one piece of evidence that suggests Willow’s Poisson distribution model is not a good fit.
-
19N.2.SL.TZ0.T_1f.ii:
Calculate the probability that the customer is an adult or that the customer chose shrimp.
-
18M.1.SL.TZ1.T_10c:
Write down the value of .
-
19M.1.SL.TZ1.S_9c:
Write down the standardized value for .
-
19N.2.SL.TZ0.T_1f.iii:
Given that the customer is a child, calculate the probability that they chose pasta or fish.
-
18M.2.SL.TZ1.S_5a:
Find P(A ∩ B′ ).
-
18M.2.SL.TZ1.S_9b.ii:
Hence, find the value of σ.
-
17M.1.AHL.TZ1.H_10b.ii:
By considering the graph of f write down the median of ;
-
17M.1.SL.TZ2.T_10c:
Write down an expression, in terms of , for the probability that at least one of Deborah’s three light bulbs is defective.
-
18M.2.SL.TZ1.S_9d:
Find the probability that the grocer buys more than half the oranges in a box selected at random.
-
18M.1.SL.TZ2.T_9a.ii:
Write down an expression, in set notation, for the shaded region represented by Diagram 2.
-
18N.2.SL.TZ0.T_2b.ii:
Write down .
-
17M.1.SL.TZ1.T_4c.ii:
Write down .
-
18M.2.SL.TZ1.S_9b.i:
Find the standardized value for 289 g.
-
16N.1.SL.TZ0.T_3b:
On the Venn diagram, shade the region .
-
17M.2.AHL.TZ2.H_5a:
Draw a tree diagram to represent this information for the first three days of July.
-
19M.2.SL.TZ2.T_1e.iii:
Find the probability that at least one of the two students is female.
-
16N.2.AHL.TZ0.H_11d:
(i) Hence show that has two modes and .
(ii) State the values of and .
-
17N.2.SL.TZ0.S_4a:
Find the value of .
-
19M.1.SL.TZ1.T_12a:
Find the probability that both spins are yellow.
-
18N.1.SL.TZ0.S_9a.i:
Find the probability, in terms of , that the game will end on her first draw.
-
19N.2.SL.TZ0.T_1e:
State the conclusion for this test. Give a reason for your answer.
-
19M.1.SL.TZ1.T_12b:
Find the probability that at least one of the spins is yellow.
-
19M.2.SL.TZ2.T_1e.i:
Find the probability that the student does not take the Spanish class.
-
17N.2.SL.TZ0.T_4a:
Find the probability that this person is not allergic to nuts.
-
19N.2.SL.TZ0.T_1c:
Show that the expected number of children who chose shrimp is , correct to two significant figures.
-
17M.2.AHL.TZ2.H_5c:
Find the probability that the 1st July was calm given that the 3rd July is windy.
-
21M.2.SL.TZ2.1e:
Draw a Venn diagram to illustrate this information, placing all relevant information on the diagram.
-
18N.2.SL.TZ0.S_9d:
Ten of the participants with reaction times greater than 0.65 are selected at random. Find the probability that at least two of them are in Group X.
-
16N.1.AHL.TZ0.H_10a:
Show that .
-
17M.1.SL.TZ2.T_2c:
Find the number of children who play only football.
-
18N.1.SL.TZ0.T_14a:
Find the value of k.
-
17M.2.AHL.TZ2.H_1a:
One of the players is chosen at random. Find the probability that this player’s score was 5 or more.
-
18M.2.SL.TZ2.T_1b.ii:
Use the tree diagram to find the probability that an employee was late for work.
-
17N.2.SL.TZ0.T_4b:
Find the probability that both people chosen are not allergic to nuts.
-
17N.2.AHL.TZ0.H_2c:
Hence show that events and are independent.
-
18N.1.SL.TZ0.S_9b.ii:
fourth draw.
-
16N.2.AHL.TZ0.H_11b:
Find the values of the constants and .
-
18M.2.AHL.TZ1.H_8:
Each of the 25 students in a class are asked how many pets they own. Two students own three pets and no students own more than three pets. The mean and standard deviation of the number of pets owned by students in the class are and respectively.
Find the number of students in the class who do not own a pet.
-
EXN.1.AHL.TZ0.6b:
Find the probability it will not rain while Paula is outside.
-
19M.2.AHL.TZ2.H_3c:
Find the probability that Iqbal passes his third paper, given that he passed only one previous paper.
-
17N.2.AHL.TZ0.H_2a:
Find .
-
19M.1.SL.TZ1.S_9a:
Find P(−1.6 < < 2.4). Write your answer in terms of and .
-
EXN.1.AHL.TZ0.6a:
Write down the probability it rains during Paula’s lunch break.
-
18M.1.SL.TZ2.S_8e:
Two days next week Pablo will drive to work. Find the probability that he will be late at least once.
-
17M.2.SL.TZ1.S_9b:
Find the value of .
-
17N.1.SL.TZ0.T_7b:
One of the students who joined the sports club is chosen at random. Find the probability that this student joined both clubs.
-
16N.2.SL.TZ0.T_2b:
Show that .
-
SPM.1.SL.TZ0.12b:
Calculate the expected score.
-
16N.2.AHL.TZ0.H_11a:
Show that and .
-
18M.2.SL.TZ2.T_1b.i:
Use the tree diagram to find the probability that an employee encountered traffic and was late for work.
-
18M.2.SL.TZ1.T_5b:
Find the probability that only one of Ayako and Natsuko falls into a trap while attempting to pass through a door in the first wall.
-
16N.2.SL.TZ0.T_6f:
Using your answer to part (e), find the value of which minimizes .
-
18M.2.AHL.TZ1.H_6:
The mean number of squirrels in a certain area is known to be 3.2 squirrels per hectare of woodland. Within this area, there is a 56 hectare woodland nature reserve. It is known that there are currently at least 168 squirrels in this reserve.
Assuming the population of squirrels follow a Poisson distribution, calculate the probability that there are more than 190 squirrels in the reserve.
-
18N.2.SL.TZ0.T_2b.i:
Write down .
-
17M.2.AHL.TZ1.H_1a:
Calculate ;
-
19M.2.SL.TZ2.T_1e.ii:
Find the probability that neither of the two students take the Spanish class.
-
19N.2.SL.TZ0.T_1f.i:
Calculate the probability that the customer is an adult.
-
20N.1.SL.TZ0.S_1a.i:
Find the value of .
-
20N.1.SL.TZ0.S_1a.ii:
Find the value of .
-
20N.1.SL.TZ0.S_1b:
Find the probability that a randomly selected student from the class plays tennis or volleyball, but not both.
-
20N.2.SL.TZ0.S_9d:
Find the probability that Fiona will arrive on time.
-
20N.1.SL.TZ0.T_14a:
Complete the values in the tree diagram.

-
20N.1.SL.TZ0.T_6a.ii:
Find the probability that the first ball chosen is labelled or labelled .
-
20N.2.SL.TZ0.T_2a.i:
Find the value of .
-
17M.2.SL.TZ2.S_10d:
Grant plays the game until he wins two prizes. Find the probability that he wins his second prize on his eighth attempt.
-
19M.1.SL.TZ2.T_5c:
A student is chosen at random from the surveyed students.
Find the probability that this student likes kiwi fruit smoothies given that they like mango smoothies.
-
20N.2.SL.TZ0.S_9c:
Find the probability that the bus journey takes less than minutes.
-
20N.2.SL.TZ0.S_9e:
This year, Fiona will go to school on days.
Calculate the number of days Fiona is expected to arrive on time.
-
20N.1.SL.TZ0.T_14c:
Given that Andre did not become the champion, find the probability that he lost in the semi-final.
-
20N.2.SL.TZ0.T_2a.ii:
Find the value of .
-
20N.2.SL.TZ0.T_2b:
Find the number of students who visited at least two types of main attraction.
-
20N.2.SL.TZ0.T_2c:
Write down the value of .
-
20N.2.SL.TZ0.T_2d.i:
Find the probability that a randomly selected student visited the rollercoasters.
-
20N.2.SL.TZ0.T_2d.ii:
Find the probability that a randomly selected student visited the virtual reality rides.
-
17N.2.AHL.TZ0.H_2b:
Find .
-
17M.1.SL.TZ1.T_7b:
Find the probability that Sara’s baggage arrives in London.
-
16N.2.SL.TZ0.T_6e:
Find .
-
19N.1.SL.TZ0.T_9b:
Find the probability that Sungwon scores greater than on both of her first two turns.
-
17N.1.SL.TZ0.T_7c:
Determine whether the events and are independent.
-
EXN.1.SL.TZ0.10a:
Write down the probability it rains during Paula’s lunch break.
-
EXN.1.SL.TZ0.10c:
Find the probability it will not rain while Paula is outside.
-
EXN.1.SL.TZ0.10d:
Find the probability it will rain at least once while Paula is outside.
-
17M.2.AHL.TZ2.H_5b:
Find the probability that the 3rd July is calm.
-
16N.1.SL.TZ0.S_5a:
Find .
-
19M.2.SL.TZ1.S_10b:
Show that, after a turn, the probability that Ted adds exactly $10 to his winnings is .
-
19M.1.SL.TZ1.S_9b:
Given that > −1.6, find the probability that z < 2.4 . Write your answer in terms of and .
-
17M.1.SL.TZ2.T_2a:
Write down an expression, in terms of , for the number of children who play only basketball.
-
17N.2.SL.TZ0.S_4c:
Find .
-
17N.2.SL.TZ0.T_4e:
Find the probability that the liquid turns blue.
-
18M.1.SL.TZ2.T_9a.iii:
Write down an expression, in set notation, for the shaded region represented by Diagram 3.
-
16N.1.SL.TZ0.T_12a:
Complete the tree diagram below.
-
18M.1.SL.TZ1.T_10b:
Find the value of x.
-
17M.2.SL.TZ2.S_10a.i:
Find .
-
18M.2.SL.TZ1.S_5b:
Given that P((A ∪ B)′ ) = 0.19, find P(A | B′ ).
-
16N.2.AHL.TZ0.H_11e:
Determine the minimum value of such that the probability Kati receives at least one free gift is greater than 0.5.
-
18M.2.SL.TZ1.T_2e:
State, with a reason, whether you would reject the null hypothesis.
-
17N.1.SL.TZ0.T_7a:
Complete the Venn diagram for these students.
-
17M.1.SL.TZ1.S_1a.ii:
Find the value of .
-
19N.1.SL.TZ0.T_9a:
Find the probability that Sungwon’s score on her first turn is greater than .
-
20N.2.SL.TZ0.S_9b:
Find .
-
19M.2.SL.TZ2.S_9d:
All flights have two pilots. Find the percentage of flights where both pilots flew more than 30 hours last week.
-
19M.2.AHL.TZ2.H_3b:
Calculate the probability that Iqbal passes at least two of the papers he attempts.
-
19M.2.AHL.TZ1.H_9c.ii:
A female customer is selected at random. Find the probability that she buys a sandwich.
-
19M.2.SL.TZ2.S_9b.i:
Find .
-
18N.1.SL.TZ0.T_8b:
Find the probability that Jorgé chooses a red disc.
-
20N.1.SL.TZ0.T_6c:
Find the probability that both balls chosen are labelled .
-
20N.1.SL.TZ0.T_6a.i:
Find the probability that the first ball chosen is labelled .
-
20N.2.SL.TZ0.T_2e:
Hence determine whether the events in parts (d)(i) and (d)(ii) are independent. Justify your reasoning.
-
17M.2.SL.TZ2.S_B10c:
Jill plays the game nine times. Find the probability that she wins exactly two prizes.
-
18N.1.SL.TZ0.S_9b.i:
third draw.
-
17M.2.SL.TZ2.S_10b.ii:
Explain why the probability of drawing three white marbles is .
-
16N.2.SL.TZ0.T_2a:
Draw a Venn diagram to represent the given information, using sets labelled , and .
-
17M.1.SL.TZ2.T_10b.ii:
Find the probability that at least one of Francesco’s light bulbs is defective.
-
18M.2.SL.TZ1.T_5a:
Write down the probability that Ayako avoids the trap in this wall.
-
16N.2.SL.TZ0.T_6c:
Write down, in terms of and , an equation for the volume of this water container.
-
17M.1.SL.TZ2.T_10b.i:
Find the probability that both light bulbs are not defective.
-
18M.2.SL.TZ1.S_9e:
The grocer selects two boxes at random.
Find the probability that the grocer buys more than half the oranges in each box.
-
16N.2.SL.TZ0.T_6a:
Write down a formula for , the surface area to be coated.
-
16N.2.SL.TZ0.T_6h:
Find the least number of cans of water-resistant material that will coat the area in part (g).
-
18M.2.SL.TZ1.T_2b:
Calculate the expected frequency of flights travelling at most 500 km and arriving slightly delayed.
-
17M.2.SL.TZ2.S_10a.ii:
Find .
-
17M.1.SL.TZ1.T_4d:
Write down, in terms of , and , an expression for the set which contains only archery, baseball, kayaking and surfing.
-
19M.1.SL.TZ1.S_1a:
Find the value of .
-
19M.2.SL.TZ2.S_9c:
Find the value of .
-
16N.2.SL.TZ0.T_6d:
Show that .
-
19N.1.SL.TZ0.T_9c:
Sungwon will play the game for turns.
Find the expected number of times the score on a turn is greater than .
-
17M.2.AHL.TZ2.H_1b:
Calculate the mean score.
-
18M.2.SL.TZ1.T_5d.ii:
A contestant is chosen at random. Find the probability that this contestant fell into a trap.
-
18N.2.SL.TZ0.T_2c.ii:
Find the probability that this student studies neither Biology nor Mathematics.
-
18M.1.SL.TZ2.T_7b:
Find the probability that the boy answered questions in Hindi.
-
20N.1.SL.TZ0.T_6b:
Find the probability that the second ball chosen is labelled , given that the first ball chosen was labelled .
-
18M.2.SL.TZ1.T_2f:
Write down the probability that this flight arrived on time.
-
18M.2.SL.TZ1.T_2h:
Two flights are chosen at random from those which were slightly delayed.
Find the probability that each of these flights travelled at least 5000 km.
-
SPM.1.SL.TZ0.12c:
Jae Hee plays the game twice and adds the two scores together.
Find the probability Jae Hee has a total score of −3.
-
17M.2.SL.TZ2.S_10b.iii:
The bag contains a total of ten marbles of which are white. Find .
-
21M.2.SL.TZ2.1b.iv:
.
-
21M.2.SL.TZ2.1b.ii:
.
-
21M.2.SL.TZ2.1d:
The medical centre finds the actual number of positive results in their sample is different than predicted by the tree diagram. Explain why this might be the case.
-
21M.2.SL.TZ2.1b.iii:
.
-
21M.2.SL.TZ2.1c.i:
will not have the disease and will test positive.
-
21M.2.SL.TZ2.1c.ii:
will test negative.
-
21M.2.SL.TZ2.1c.iii:
has the disease given that they tested negative.
-
21M.2.SL.TZ2.1f:
Find the total number of patients who visited the centre during this day.
-
16N.2.AHL.TZ0.H_11c:
Deduce that for .
-
19M.1.SL.TZ2.T_11b.i:
Write down the elements that belong to .
-
16N.1.AHL.TZ0.H_10b:
(i) show that ;
(ii) hence find .
-
17M.2.SL.TZ1.S_9a:
Find .
-
21M.2.AHL.TZ2.2e:
A cat is selected at random from all cats.
Find the probability that the cat was female, given that its weight was over .
-
16N.2.SL.TZ0.T_6g:
Find the value of this minimum area.
-
16N.1.SL.TZ0.S_5b:
Find .
-
18N.1.SL.TZ0.T_14c:
Given that Naomi attends Marron College, find the probability that she achieved a mark of at least 500 on the test.
-
18N.1.SL.TZ0.S_9a.ii:
Find the probability, in terms of , that the game will end on her second draw.
-
18M.2.SL.TZ1.T_5d.i:
A contestant is chosen at random. Find the probability that this contestant fell into a trap while attempting to pass through a door in the second wall.
-
18M.2.SL.TZ2.T_1b.iii:
Use the tree diagram to find the probability that an employee encountered traffic given that they were late for work.
-
17M.1.AHL.TZ1.H_10b.iii:
By considering the graph of f write down the mode of .
-
19M.2.SL.TZ1.S_10d:
Ted will always have another turn if he expects an increase to his winnings.
Find the least value of for which Ted should end the game instead of having another turn.
-
17M.1.AHL.TZ1.H_10c.i:
Show that .
-
20N.1.SL.TZ0.T_14b:
Find the value of .
-
18N.2.SL.TZ0.T_2c.iii:
Find the probability that this student is taught in Spanish, given that the student studies Biology.
-
20N.2.SL.TZ0.S_9a:
Find the probability that it will take Fiona between minutes and minutes to walk to the bus stop.
-
17M.1.AHL.TZ1.H_10c.ii:
Hence state the interquartile range of .
-
17M.2.AHL.TZ1.H_1b:
Find .
-
16N.2.SL.TZ0.T_2d:
Find the probability that this person
(i) went on at most one trip;
(ii) went on the coach trip, given that this person also went on both the helicopter trip and the boat trip.
-
21N.2.SL.TZ0.5d.i:
Find the probability that Arianne scores at least points in the competition.
-
EXN.1.AHL.TZ0.6d:
Given it rains at least once while Paula is outside find the probability that it rains during her lunch hour.
-
21N.2.AHL.TZ0.3d.iv:
Given that Arianne scores at least points, find the probability that Arianne scores less than points.
-
21N.2.SL.TZ0.5a.i:
a dart lands less than from .
-
21N.2.SL.TZ0.1a.i:
prefers a tablet.
-
21N.2.SL.TZ0.1a.ii:
is years old and prefers a mobile phone.
-
21N.2.SL.TZ0.1a.iii:
prefers a laptop given that they are years old.
-
21N.2.SL.TZ0.1a.iv:
prefers a tablet or is years old.
-
21N.2.SL.TZ0.1c:
Write down the number of degrees of freedom.
-
21N.2.SL.TZ0.1d.i:
Write down the test statistic.
-
21N.2.SL.TZ0.1d.ii:
Write down the -value.
-
21N.2.SL.TZ0.1d.iii:
State the conclusion for the test in context. Give a reason for your answer.
-
21N.2.SL.TZ0.5a.ii:
a dart lands more than from .
-
21N.2.SL.TZ0.5c:
Find the probability that Arianne does not score a point on a turn of three darts.
-
21N.2.SL.TZ0.5d.ii:
Find the probability that Arianne scores at least points and less than points.
-
21N.2.SL.TZ0.5d.iii:
Given that Arianne scores at least points, find the probability that Arianne scores less than points.
-
21N.2.AHL.TZ0.3a.i:
a dart lands less than from .
-
21N.2.AHL.TZ0.3a.ii:
a dart lands more than from .
-
21N.2.AHL.TZ0.3c:
Find the probability that Arianne does not score a point on a turn of three darts.
-
21N.2.AHL.TZ0.3d.i:
Find Arianne’s expected score in the competition.
-
21N.2.AHL.TZ0.3d.ii:
Find the probability that Arianne scores at least points in the competition.
-
21N.2.AHL.TZ0.3d.iii:
Find the probability that Arianne scores at least points and less than points.