| Date | November 2017 | Marks available | 3 | Reference code | 17N.2.SL.TZ0.S_8 |
| Level | Standard Level | Paper | Paper 2 | Time zone | Time zone 0 |
| Command term | Write down | Question number | S_8 | Adapted from | N/A |
Question
Adam is a beekeeper who collected data about monthly honey production in his bee hives. The data for six of his hives is shown in the following table.
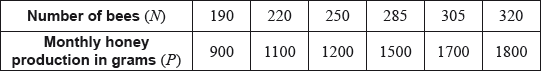
The relationship between the variables is modelled by the regression line with equation .
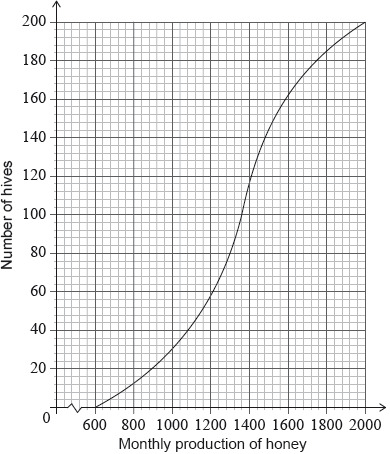
Adam has 200 hives in total. He collects data on the monthly honey production of all the hives. This data is shown in the following cumulative frequency graph.
Adam’s hives are labelled as low, regular or high production, as defined in the following table.
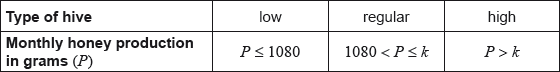
Adam knows that 128 of his hives have a regular production.
Write down the value of and of .
Use this regression line to estimate the monthly honey production from a hive that has 270 bees.
Write down the number of low production hives.
Find the value of ;
Find the number of hives that have a high production.
Adam decides to increase the number of bees in each low production hive. Research suggests that there is a probability of 0.75 that a low production hive becomes a regular production hive. Calculate the probability that 30 low production hives become regular production hives.
Markscheme
* This question is from an exam for a previous syllabus, and may contain minor differences in marking or structure.
evidence of setup (M1)
egcorrect value for or
A1A1 N3
[3 marks]
substituting into their equation (M1)
eg
1424.67
A1 N2
[2 marks]
40 (hives) A1 N1
[1 mark]
valid approach (M1)
eg
168 hives have a production less than (A1)
A1 N3
[3 marks]
valid approach (M1)
eg
32 (hives) A1 N2
[2 marks]
recognize binomial distribution (seen anywhere) (M1)
eg
correct values (A1)
eg (check FT) and and
0.144364
0.144 A1 N2
[3 marks]
Examiners report
Syllabus sections
-
22M.2.SL.TZ2.1b:
Find the estimated number of teenagers who have a reaction time greater than seconds.
-
22M.2.SL.TZ2.1d.ii:
Write down the value of .
-
17M.1.SL.TZ2.S_8b.i:
Find the amount of money an employee earned for working 40 hours;
-
19M.1.SL.TZ2.T_12b:
On the same grid, complete the cumulative frequency curve for these data.
-
18M.2.SL.TZ2.T_2e:
Find the number of buses that travelled a distance less than or equal to 12 000 km.
-
18M.2.SL.TZ2.T_2g:
The smallest distance travelled by one of the buses was 2500 km.
The longest distance travelled by one of the buses was 23 000 km.On graph paper, draw a box-and-whisker diagram for these data. Use a scale of 2 cm to represent 5000 km.
-
19M.1.SL.TZ2.T_12a.i:
.
-
19M.1.SL.TZ1.T_5a:
Complete the cumulative frequency table.
-
17M.1.SL.TZ2.T_6a:
Write down the median length of these leaves.
-
18M.2.SL.TZ1.T_2g:
Given that this flight was not heavily delayed, find the probability that it travelled between 500 km and 5000 km.
-
19N.1.SL.TZ0.T_13c:
Use your graphic display calculator to find an estimate for the standard deviation of the weight of the eggs.
-
19N.1.SL.TZ0.T_13b:
Write down the modal grade of the eggs.
-
17N.1.SL.TZ0.T_1b:
Draw a box-and-whisker diagram, for these students’ ages, on the following grid.
-
22M.2.SL.TZ2.1a.ii:
interquartile range of the reaction times.
-
22M.2.SL.TZ2.1c:
Determine the percentile of the reaction times from the cumulative frequency graph.
-
22M.2.SL.TZ2.1d.i:
Write down the value of .
-
22M.2.SL.TZ2.1a.i:
median reaction time.
-
22M.1.SL.TZ2.7b:
With reference to the box and whisker diagrams, state one aspect that may support the researcher’s opinion and one aspect that may counter it.
-
18M.2.SL.TZ2.T_2f:
Find the value of m.
-
17M.1.SL.TZ2.T_6b:
Write down the number of leaves with a length less than or equal to 8 cm.
-
18M.2.SL.TZ1.T_2d.ii:
Write down the associated p-value.
-
17N.2.SL.TZ0.T_1b.ii:
Write down, for , the mid-interval value of the modal class.
-
18M.2.SL.TZ2.T_2d:
Write down the percentage of buses that travelled a distance greater than the upper quartile.
-
19M.1.SL.TZ2.T_6c:
The health inspector visits two school cafeterias. She inspects the same number of meals at each cafeteria. The data is shown in the following box-and-whisker diagrams.

Meals prepared in the school cafeterias are required to have less than 10 grams of sugar.
State, giving a reason, which school cafeteria has more meals that do not meet the requirement.
-
17N.1.SL.TZ0.T_1a.ii:
For the students in this group write down the median age.
-
19M.1.SL.TZ1.T_5b:
Write down the probability that a bouquet of roses sold is not small.
-
18M.1.SL.TZ2.T_7a:
State the number of boys who answered questions in Portuguese.
-
19N.2.SL.TZ0.T_1d.ii:
the -value.
-
17M.1.SL.TZ2.T_7c:
Find the value of and of .
-
18M.2.SL.TZ1.T_2d.i:
Write down the χ2 statistic.
-
18M.2.SL.TZ2.T_2b.ii:
Use the cumulative frequency curve to find the lower quartile.
-
19M.1.SL.TZ2.T_12a.ii:
.
-
18M.2.SL.TZ1.T_2a:
State the alternative hypothesis.
-
17N.2.SL.TZ0.T_1c.i:
Use your graphic display calculator to estimate the mean of ;
-
17N.2.SL.TZ0.T_1f.ii:
Write down the statistic.
-
17M.1.SL.TZ2.S_8a.ii:
Write down the number of employees who worked 50 hours or less.
-
17N.2.SL.TZ0.S_8c:
Write down the number of low production hives.
-
18M.2.SL.TZ1.T_2c:
Write down the number of degrees of freedom.
-
19M.1.SL.TZ2.T_12c:
Use the cumulative frequency curve to find an estimate for the number of students who worked at most 35 hours per month.
-
17N.2.SL.TZ0.T_1e.ii:
Write down the number of degrees of freedom.
-
19N.2.SL.TZ0.T_1d.i:
the statistic.
-
19N.2.SL.TZ0.T_1b:
Write down the number of degrees of freedom.
-
17N.2.SL.TZ0.T_1b.i:
Write down, for , the modal class;
-
19N.1.SL.TZ0.T_15a:
Write down the median rehearsal time.
-
19N.2.SL.TZ0.T_1a:
State , the null hypothesis for this test.
-
17N.2.SL.TZ0.T_1a:
State whether is a discrete or a continuous variable.
-
17N.2.SL.TZ0.T_1c.ii:
Use your graphic display calculator to estimate the standard deviation of .
-
19N.1.SL.TZ0.T_13a:
State whether the weight of the eggs is a continuous or discrete variable.
-
17N.2.SL.TZ0.S_8e:
Adam decides to increase the number of bees in each low production hive. Research suggests that there is a probability of 0.75 that a low production hive becomes a regular production hive. Calculate the probability that 30 low production hives become regular production hives.
-
19M.1.SL.TZ1.T_5c:
A customer buys a large bouquet.
Find the probability that there are 12 roses in this bouquet.
-
19N.2.SL.TZ0.T_1f.ii:
Calculate the probability that the customer is an adult or that the customer chose shrimp.
-
17M.1.SL.TZ2.T_7a:
Write down an equation, in terms of and , for the total number of times the die was rolled.
-
19N.2.SL.TZ0.T_1f.iii:
Given that the customer is a child, calculate the probability that they chose pasta or fish.
-
18M.1.SL.TZ1.T_6c.i:
Write down the mid-interval value for the 100 < x ≤ 150 group.
-
16N.2.SL.TZ0.S_8b:
During week 2, the students worked on a major project and they each spent an additional five hours browsing the Internet. For week 2, write down
(i) the mean;
(ii) the standard deviation.
-
18M.1.SL.TZ2.T_12a:
Write down the mid-interval value for 10 ≤ t < 15.
-
18M.1.SL.TZ2.T_12b.i:
Write down the total number of customers in terms of k.
-
17N.2.SL.TZ0.S_8d.i:
Find the value of ;
-
17N.2.SL.TZ0.S_8b:
Use this regression line to estimate the monthly honey production from a hive that has 270 bees.
-
EXN.1.SL.TZ0.4b.i:
Find the median weight.
-
18M.2.SL.TZ2.T_2a:
Find the number of buses that travelled a distance between 15000 and 20000 kilometres.
-
EXN.1.SL.TZ0.4b.ii:
Find the lower quartile.
-
19N.2.SL.TZ0.T_1e:
State the conclusion for this test. Give a reason for your answer.
-
EXN.1.SL.TZ0.4b.iii:
Find the upper quartile.
-
19N.2.SL.TZ0.T_1c:
Show that the expected number of children who chose shrimp is , correct to two significant figures.
-
17N.2.SL.TZ0.T_1f.i:
Write down the -value for the test;
-
17N.2.SL.TZ0.T_1e.i:
Write down the null hypothesis for this test;
-
17N.2.SL.TZ0.S_8d.ii:
Find the number of hives that have a high production.
-
17N.2.SL.TZ0.T_1g:
State the result of the test. Give a reason for your answer.
-
18M.2.SL.TZ2.T_2c:
Hence write down the interquartile range.
-
17M.1.SL.TZ2.T_7b:
Using the mean score, write down a second equation in terms of and .
-
18M.2.SL.TZ2.T_2b.i:
Use the cumulative frequency curve to find the median distance.
-
18M.2.SL.TZ2.T_2b.iii:
Use the cumulative frequency curve to find the upper quartile.
-
19N.2.SL.TZ0.T_1f.i:
Calculate the probability that the customer is an adult.
-
20N.1.SL.TZ0.S_8a:
Find the value of .
-
20N.1.SL.TZ0.T_3b:
Use your graphic display calculator to find an estimate of the standard deviation of the weights of mangoes from this harvest.
-
20N.1.SL.TZ0.T_3c:
On the grid below, draw a histogram for the data in the table.

-
17N.2.SL.TZ0.T_1d:
Find the expected frequency of students choosing the Science category and obtaining 31 to 40 correct answers.
-
20N.1.SL.TZ0.S_8b:
Write down the value of the median distance in kilometres (km).
-
20N.1.SL.TZ0.S_8d:
Find .
-
16N.1.SL.TZ0.T_2b:
Draw a box-and-whisker diagram on the grid below to represent the Vitamin C content, in milligrams, for this sample.
-
17M.1.SL.TZ1.T_1a:
Complete the following table.
-
EXN.1.SL.TZ0.4a:
Find the number of potatoes in the sample with a weight of more than grams.
-
EXN.1.SL.TZ0.4c:
The weight of the smallest potato in the sample is grams and the weight of the largest is grams.
Use the scale shown below to draw a box and whisker diagram showing the distribution of the weights of the potatoes. You may assume there are no outliers.

-
16N.2.SL.TZ0.S_8a:
Find the mean number of hours spent browsing the Internet.
-
18M.2.SL.TZ1.T_2e:
State, with a reason, whether you would reject the null hypothesis.
-
19N.1.SL.TZ0.T_15b:
State whether Stephen is correct. Give a reason for your answer.
-
20N.1.SL.TZ0.S_8c:
Find the value of .
-
20N.1.SL.TZ0.T_3a:
Write down the modal group for these data.
-
20N.1.SL.TZ0.S_8e:
The first athletes that completed the race won a prize.
Given that an athlete took between and minutes to complete the race, calculate the probability that they won a prize.
-
18M.1.SL.TZ2.T_7c:
Two girls are selected at random.
Calculate the probability that one girl answered questions in Mandarin and the other answered questions in Hindi.
-
18M.2.SL.TZ1.T_2b:
Calculate the expected frequency of flights travelling at most 500 km and arriving slightly delayed.
-
21M.2.SL.TZ1.1b:
Write down the median time to read the book.
-
16N.2.SL.TZ0.S_8d:
(i) Find the number of students who spent between 25 and 30 hours browsing the Internet.
(ii) Given that 10% of the students spent more than k hours browsing the Internet, find the maximum value of .
-
18M.1.SL.TZ2.T_7b:
Find the probability that the boy answered questions in Hindi.
-
21M.1.SL.TZ2.5a.ii:
the lower quartile.
-
21M.1.SL.TZ2.5a.i:
the minimum number of sick days taken during the year.
-
18M.2.SL.TZ1.T_2f:
Write down the probability that this flight arrived on time.
-
18M.2.SL.TZ1.T_2h:
Two flights are chosen at random from those which were slightly delayed.
Find the probability that each of these flights travelled at least 5000 km.
-
19N.1.SL.TZ0.T_15c:
On days, Stephen practiced exactly minutes.
Find the possible values of .
-
21M.2.SL.TZ1.1c:
Calculate the interquartile range.
-
19N.1.SL.TZ0.T_13d:
The mean weight of these eggs is 64.9 grams, correct to three significant figures.
Use the table and your answer to part (c) to find the smallest possible number of eggs that could be within one standard deviation of the mean.
-
16N.2.SL.TZ0.S_8c:
During week 3 each student spent 5% less time browsing the Internet than during week 1. For week 3, find
(i) the median;
(ii) the variance.
-
21M.1.SL.TZ2.5a.iii:
the median.
-
21M.1.SL.TZ2.5b:
Paul claims that this box and whisker diagram can be used to infer that the percentage of employees who took fewer than six sick days is smaller than the percentage of employees who took more than eleven sick days.
State whether Paul is correct. Justify your answer.
-
21N.1.SL.TZ0.9c.i:
Find the number of students who obtained a grade .
-
21N.1.SL.TZ0.9a:
Find the median of the scores obtained.
-
21N.1.SL.TZ0.9b:
Find an expression for in terms of .
-
21N.1.SL.TZ0.9c.ii:
Find the minimum score needed to obtain a grade .