| Date | May 2017 | Marks available | 1 | Reference code | 17M.1.SL.TZ2.S_3 |
| Level | Standard Level | Paper | Paper 1 | Time zone | Time zone 2 |
| Command term | Write down | Question number | S_3 | Adapted from | N/A |
Question
The random variable is normally distributed with a mean of 100. The following diagram shows the normal curve for .
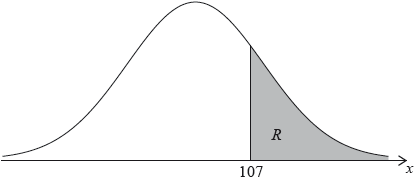
Let be the shaded region under the curve, to the right of 107. The area of is 0.24.
Write down .
Find .
Find .
Markscheme
* This question is from an exam for a previous syllabus, and may contain minor differences in marking or structure.
A1 N1
[1 mark]
valid approach (M1)
eg
correct working (A1)
eg
A1 N2
[3 marks]
valid approach (M1)
eg
A1 N2
[2 marks]
Examiners report
Syllabus sections
-
22M.1.SL.TZ1.8b:
Find the probability that a randomly chosen bag is rejected for being underweight.
-
22M.1.SL.TZ2.10a:
Determine the probability that a Fuji apple selected at random will be a large apple.
-
22M.1.SL.TZ2.10b:
Find the value of .
-
22M.1.AHL.TZ2.12b:
Find the probability of making a Type II error when weighing a female cuttlefish.
-
18M.2.SL.TZ2.S_10d.i:
Find the expected number of bags in this crate that contain at most one small apple.
-
EXM.3.AHL.TZ0.8a.ii:
Find unbiased estimates for the population Variance.
-
19M.1.SL.TZ2.T_14b:
Find the probability that the price of a kilogram of tomatoes, chosen at random, will be between 2.00 and 3.00 euro.
-
18M.1.SL.TZ1.T_13a.i:
Find the probability that a student, chosen at random arrives at least 60 minutes after the school opens.
-
18M.2.SL.TZ2.T_3a.i:
Find the probability that a basketball player has a weight that is less than 61 kg.
-
18M.2.SL.TZ2.T_3b.i:
Sketch a normal curve to represent this probability.
-
EXM.3.AHL.TZ0.8a.i:
Find unbiased estimates for the population mean.
-
18M.2.SL.TZ1.S_9a:
Find the probability that an orange weighs between 289 g and 310 g.
-
18M.2.AHL.TZ2.H_3b:
Find the value of P(μ − 2σ < X < μ + σ).
-
19N.1.SL.TZ0.T_12b:
Calculate the probability that the runner completed the race in less than minutes.
-
16N.2.SL.TZ0.T_4d:
Calculate the value of .
-
21M.1.AHL.TZ1.14a:
Find the mean weight of a bag of apples.
-
EXM.1.SL.TZ0.8b:
Test the hypothesis at the 5% level of significance.
-
21M.2.SL.TZ2.4a:
Sketch a diagram showing the above information.
-
21M.2.AHL.TZ2.2a:
Sketch a diagram showing the above information.
-
22M.1.SL.TZ1.8a:
Write down the percentage of bags that weigh more than .
-
22M.1.AHL.TZ2.12a:
Find the probability of making a Type I error when weighing a male cuttlefish.
-
21N.2.AHL.TZ0.3b:
Find the probability that Arianne throws two consecutive darts that land more than from .
-
22M.1.SL.TZ1.8c:
A bag that weighs more than grams is rejected by the factory for being overweight. The factory rejects of bags for being overweight.
Find the value of .
-
22M.1.AHL.TZ1.9a:
Find the probability that the company fails the inspection.
-
21N.2.SL.TZ0.5b:
Find the probability that Arianne throws two consecutive darts that land more than from .
-
21N.1.AHL.TZ0.14a:
Find the probability that a sack is under its labelled weight.
-
21N.1.AHL.TZ0.14b:
Find the lower quartile of the weights of the sacks of potatoes.
-
20N.2.SL.TZ0.T_6e:
Find the probability he plays between and in one game and more than in the other game.
-
19M.2.AHL.TZ2.H_2a:
Calculate the probability that, on a randomly selected day, Timmy makes a profit.
-
EXM.3.AHL.TZ0.8f:
Perform a suitable test, at the 5% significance level, to determine if it is easier to achieve a distinction on the new exam. You should clearly state your hypotheses, the critical region and your conclusion.
-
18N.3.AHL.TZ0.Hsp_3b.i:
State the distribution of your test statistic, including the parameter.
-
EXM.2.AHL.TZ0.27d:
In order to test for the goodness of fit, the test statistic was calculated to be 1.0847. Show how this was done.
-
18M.2.AHL.TZ1.H_4a:
Find the probability that a wolf selected at random is at least 5 years old.
-
18M.1.SL.TZ1.T_13b:
A second school, Mulberry Park, also opens at 08:00 every morning. The arrival times of the students at this school follows exactly the same distribution as Malthouse school.
Given that, on one morning, 15 students arrive at least 60 minutes after the school opens, estimate the number of students at Mulberry Park school.
-
18N.2.SL.TZ0.S_9c:
A randomly selected participant has a reaction time greater than 0.65 seconds. Find the probability that the participant is in Group X.
-
18M.2.SL.TZ2.S_10d.ii:
Find the probability that at least 48 bags in this crate contain at most one small apple.
-
17M.2.SL.TZ1.T_5a.ii:
Calculate the standard deviation.
-
17M.2.SL.TZ1.T_5b:
Find the median test grade of the students.
-
19M.1.SL.TZ2.T_14a.i:
On the following diagram, shade the region representing the probability that the price of a kilogram of tomatoes, chosen at random, will be higher than 3.22 euro.

-
19M.1.SL.TZ2.T_14a.ii:
Find the price that is two standard deviations above the mean price.
-
19M.1.SL.TZ2.T_14c:
To stimulate reasonable pricing, the city offers a free permit to the sellers whose price of a kilogram of tomatoes is in the lowest 20 %.
Find the highest price that a seller can charge and still receive a free permit.
-
18N.1.SL.TZ0.T_14b:
Find the probability that a randomly chosen student will be accepted by Marron College.
-
18M.1.SL.TZ1.T_13a.ii:
Find the probability that a student, chosen at random arrives between 45 minutes and 55 minutes after the school opens.
-
18M.2.SL.TZ2.T_3b.ii:
Find the value of q.
-
EXM.3.AHL.TZ0.8d:
Use the normal distribution model to find the score required to pass.
-
18N.3.AHL.TZ0.Hsp_3c.iii:
State the p-value and interpret it in this context.
-
18M.2.SL.TZ2.T_3c:
Given that P(W > k) = 0.225 , find the value of k.
-
17M.1.SL.TZ2.T_11a:
Write down the probability that the mass of one of these corncobs is greater than 400 grams.
-
EXM.3.AHL.TZ0.8c:
Perform a suitable test, at the 5% significance level, to determine if the scores follow a normal distribution, with the mean and variance found in part (a). You should clearly state your hypotheses, the degrees of freedom, the p-value and your conclusion.
-
19M.2.SL.TZ2.S_9a:
Show that event A and event D are not independent.
-
19M.1.SL.TZ1.T_11a:
In the following table, write down the letter of the corresponding graph next to the given mean and standard deviation.

-
19M.1.SL.TZ1.T_11b:
Find the probability that a suitcase weighs less than 15 kg.
-
19M.1.SL.TZ1.T_11c:
Any suitcase that weighs more than kg is identified as excess baggage.
19.6 % of the suitcases at this airport are identified as excess baggage.Find the value of .
-
19M.2.SL.TZ2.S_9b.ii:
Given that all passengers for a flight arrive on time, find the probability that the flight does not depart on time.
-
17M.2.SL.TZ1.S_9d:
Given that , find .
-
17M.2.SL.TZ1.T_5e:
Given that the first student chosen at random scored a grade 5 or higher, find the probability that both students scored a grade 6.
-
17N.2.SL.TZ0.S_7:
The heights of adult males in a country are normally distributed with a mean of 180 cm and a standard deviation of . 17% of these men are shorter than 168 cm. 80% of them have heights between and 192 cm.
Find the value of .
-
17M.2.SL.TZ1.T_5c:
Find the interquartile range.
-
18M.2.SL.TZ1.S_9c:
To the nearest gram, find the minimum weight of an orange that the grocer will buy.
-
EXM.1.SL.TZ0.8a:
Copy and complete the table, showing how you arrived at your answers.
-
EXM.1.AHL.TZ0.59b.ii:
Calculate the value of the statistic and state your conclusion using a 10% level of significance.
-
EXM.2.AHL.TZ0.26b:
The data from the two samples above are combined to form a single set of data. The following frequency table gives the observed frequencies for the combined sample. The data has been divided into five intervals.

Test, at the 5% level, whether the combined data can be considered to be a sample from a normal population with a mean of 380.
-
17M.2.AHL.TZ1.H_9b:
Calculate .
-
18M.2.SL.TZ2.T_3a.ii:
In a training session there are 40 basketball players.
Find the expected number of players with a weight less than 61 kg in this training session.
-
EXM.1.AHL.TZ0.59b.i:
State suitable hypotheses.
-
17M.2.SL.TZ1.S_9c:
Find .
-
EXM.2.AHL.TZ0.27a.ii:
the level of significance of a hypothesis test.
-
19N.1.SL.TZ0.T_12a:
Write down the probability that the runner completed the race in more than minutes.
-
19M.1.SL.TZ1.S_9d:
It is also known that P( > 2) = .
Find .
-
EXM.2.AHL.TZ0.27b:
Find the mean and standard deviation of the sample data in the table above. Show how you arrived at your answers.
-
18N.3.AHL.TZ0.Hsp_3c.i:
State suitable hypotheses for the test.
-
16N.2.AHL.TZ0.H_8b:
Find .
-
17M.1.SL.TZ2.T_11c:
Estimate the interquartile range of the distribution.
-
19M.1.SL.TZ1.S_9c:
Write down the standardized value for .
-
18M.2.SL.TZ1.S_9b.ii:
Hence, find the value of σ.
-
19N.1.SL.TZ0.T_12c:
It is known that of the runners took more than minutes and less than minutes to complete the race.
Find the value of .
-
19M.2.AHL.TZ2.H_2b:
The shop is open for 24 days every month.
Calculate the probability that, in a randomly selected month, Timmy makes a profit on between 5 and 10 days (inclusive).
-
18M.2.SL.TZ1.S_9d:
Find the probability that the grocer buys more than half the oranges in a box selected at random.
-
17M.2.AHL.TZ2.H_3c:
Calculate the new value of .
-
18M.2.SL.TZ1.S_9b.i:
Find the standardized value for 289 g.
-
18N.2.AHL.TZ0.H_3b:
Find the probability that a randomly selected Infiglow battery will have a life of at least 15 hours.
-
17N.1.SL.TZ0.T_13a:
Find the probability that this applicant took at least 40 minutes to complete the test.
-
16N.2.SL.TZ0.T_4b:
(i) Find the probability that a box of cereal, chosen at random, is sold.
(ii) Calculate the manufacturer’s expected daily income from these sales.
-
18N.3.AHL.TZ0.Hsp_3d:
Use an appropriate regression line to estimate the weight of a fish with length 360 mm.
-
18M.2.AHL.TZ2.H_3a:
Sketch the probability density function for X, and shade the region representing P(μ − 2σ < X < μ + σ).
-
18M.2.AHL.TZ2.H_3c:
Find the value of k for which P(μ − kσ < X < μ + kσ) = 0.5.
-
EXM.3.AHL.TZ0.8b:
Show that the expected frequency for 20 < ≤ 4 is 31.5 correct to 1 decimal place.
-
21M.2.SL.TZ2.4c:
Determine the expected number of cats in this group that have a weight of less than .
-
18N.2.SL.TZ0.S_9d:
Ten of the participants with reaction times greater than 0.65 are selected at random. Find the probability that at least two of them are in Group X.
-
17M.1.SL.TZ2.T_11b:
Find the value of .
-
16N.2.SL.TZ0.T_4a:
Draw a diagram that shows this information.
-
18N.1.SL.TZ0.T_14a:
Find the value of k.
-
EXM.3.AHL.TZ0.8g.i:
Find the probability of making a Type I error.
-
17M.2.AHL.TZ1.H_9a:
Find the probability that a runner selected at random will complete the marathon in less than 3 hours.
-
17M.2.AHL.TZ2.H_3b:
Calculate the new value of giving your answer correct to two decimal places.
-
19M.1.SL.TZ1.S_9a:
Find P(−1.6 < < 2.4). Write your answer in terms of and .
-
17M.2.SL.TZ1.S_9b:
Find the value of .
-
EXN.2.AHL.TZ0.6a:
Find the probability that a melon selected at random will have a mass greater than .
-
18N.3.AHL.TZ0.Hsp_3a.i:
Find the probability that a fish from this lake will have a weight of more than 560 grams.
-
18N.3.AHL.TZ0.Hsp_3b.iii:
State the conclusion of the test, justifying your answer.
-
16N.2.AHL.TZ0.H_8a:
Find and .
-
17N.2.AHL.TZ0.H_4:
It is given that one in five cups of coffee contain more than 120 mg of caffeine.
It is also known that three in five cups contain more than 110 mg of caffeine.Assume that the caffeine content of coffee is modelled by a normal distribution.
Find the mean and standard deviation of the caffeine content of coffee. -
EXM.1.AHL.TZ0.59a:
Calculate unbiased estimates of the population mean and the population variance.
-
20N.2.SL.TZ0.T_6a:
Sketch a diagram to represent this information.
-
20N.2.SL.TZ0.T_6b:
Show that .
-
20N.2.SL.TZ0.T_6c.i:
Find the probability that Emlyn plays between and in a game.
-
20N.2.SL.TZ0.T_6c.ii:
Find the probability that Emlyn plays more than in a game.
-
20N.2.SL.TZ0.T_6d:
Find the value of .
-
20N.2.SL.TZ0.T_6f:
Find the expected number of successful shots Emlyn will make on Monday, based on the results from Saturday and Sunday.
-
20N.2.SL.TZ0.T_6g:
Emlyn claims the results from Saturday and Sunday show that his expected number of successful shots will be more than Johan’s.
Determine if Emlyn’s claim is correct. Justify your reasoning.
-
16N.2.SL.TZ0.T_4c:
Calculate the manufacturer’s expected daily recycling cost.
-
17M.2.AHL.TZ1.H_9c:
Find the standard deviation of the times taken by female runners.
-
18N.3.AHL.TZ0.Hsp_3c.ii:
Find the product-moment correlation coefficient .
-
19M.1.AHL.TZ1.H_6a:
.
-
18M.2.SL.TZ2.S_10a.ii:
Show that μ = 106.
-
18M.2.SL.TZ2.T_3d.i:
For this test state the null hypothesis.
-
18N.3.AHL.TZ0.Hsp_3a.ii:
The maximum weight a hand net can hold is 6 kg. Find the probability that a catch of 11 fish can be carried in the hand net.
-
19M.1.SL.TZ1.S_9b:
Given that > −1.6, find the probability that z < 2.4 . Write your answer in terms of and .
-
17N.1.SL.TZ0.T_13b:
Find the value of .
-
18N.3.AHL.TZ0.Hsp_3b.ii:
Find the p-value for the test.
-
17M.2.SL.TZ1.T_5f.ii:
Calculate the expected number of students that spent at least 90 minutes preparing for the test.
-
19M.2.SL.TZ2.S_9d:
All flights have two pilots. Find the percentage of flights where both pilots flew more than 30 hours last week.
-
17M.2.AHL.TZ2.H_3a:
Given that and find the probability that a randomly chosen packet of biscuits is underweight.
-
17M.1.SL.TZ2.S_3b:
Find .
-
19M.2.SL.TZ2.S_9b.i:
Find .
-
18M.2.SL.TZ2.S_10b:
Find P(M < 95) .
-
21M.2.AHL.TZ2.2b:
Find the proportion of male Persian cats weighing between and .
-
21M.2.AHL.TZ2.2c:
Determine the expected number of cats in this group that have a weight of less than .
-
18M.2.SL.TZ1.S_9e:
The grocer selects two boxes at random.
Find the probability that the grocer buys more than half the oranges in each box.
-
16N.2.SL.TZ0.S_5b:
A newborn baby has a low birth weight.
Find the probability that the baby weighs at least 2.15 kg.
-
17M.2.SL.TZ1.T_5a.i:
Calculate the mean test grade of the students;
-
EXM.2.AHL.TZ0.26a:
The scientists wish to investigate the claim that Group B gain weight faster than Group A. Test this claim at the 5% level of significance, noting which hypothesis test you are using. You may assume that the weight gain for each group is normally distributed, with the same variance, and independent from each other.
-
17M.2.SL.TZ1.T_5d:
Find the probability that this student scored a grade 5 or higher.
-
18M.2.SL.TZ2.S_10c:
Find the probability that a bag of apples selected at random contains at most one small apple.
-
17M.1.SL.TZ2.S_3c:
Find .
-
21M.2.SL.TZ1.4a.i:
in less than .
-
21M.2.SL.TZ1.4a.ii:
in more than .
-
18M.2.SL.TZ2.T_3d.ii:
For this test find the p-value.
-
21M.2.SL.TZ1.4b.i:
and .
-
18M.2.AHL.TZ1.H_4b:
Eight wolves are independently selected at random and their ages recorded.
Find the probability that more than six of these wolves are at least 5 years old.
-
19M.2.SL.TZ2.S_9c:
Find the value of .
-
18M.2.SL.TZ2.S_10a.i:
Write down the value of k.
-
17N.1.SL.TZ0.T_13c:
Estimate the number of applicants who completed the test in less than 25 minutes.
-
EXM.2.AHL.TZ0.27a.i:
a goodness of fit test (a complete explanation required);
-
16N.2.SL.TZ0.S_5a:
Given that 5.3% of newborn babies have a low birth weight, find .
-
EXM.2.AHL.TZ0.27c:
Most of the expected frequencies have been calculated in the third column. (Frequencies have been rounded to the nearest integer, and frequencies in the first and last classes have been extended to include the rest of the data beyond 15 and 225. Find the values of , and and show how you arrived at your answers.
-
17M.2.SL.TZ1.S_9a:
Find .
-
21M.2.SL.TZ2.4b:
Find the proportion of male Persian cats weighing between and .
-
21M.2.AHL.TZ2.4a:
Write down a transition matrix indicating the annual population movement between clinics.
-
18N.1.SL.TZ0.T_14c:
Given that Naomi attends Marron College, find the probability that she achieved a mark of at least 500 on the test.
-
19M.1.AHL.TZ1.H_6b:
.
-
18M.2.SL.TZ2.T_3e:
State a conclusion for this test. Justify your answer.
-
EXN.1.SL.TZ0.3a:
Find the probability that an apple from the tree has a weight greater than grams.
-
18N.2.AHL.TZ0.H_3a:
Find the value of and the value of .
-
EXM.2.AHL.TZ0.27e:
State your hypotheses, critical number, decision rule and conclusion (using a 5% level of significance).
-
EXM.3.AHL.TZ0.8e:
Perform a suitable test, at the 5% significance level, to determine if there is a difference between the mean scores of males and females. You should clearly state your hypotheses, the p-value and your conclusion.
-
EXM.3.AHL.TZ0.8g.ii:
Given that find the probability of making a Type II error.
-
17M.2.SL.TZ1.T_5f.i:
Calculate the probability that a student chosen at random spent at least 90 minutes preparing for the test.
-
21M.2.AHL.TZ2.4b:
Find a prediction for the ratio of the number of patients Doctor Black will have, compared to Doctor Green, after two years.
-
21M.1.AHL.TZ1.14c:
Find the probability that a bag selected at random weighs more than .
-
21M.2.SL.TZ1.4b.ii:
and .
-
21M.1.AHL.TZ1.14b:
Find the standard deviation of the weights of these bags of apples.
-
21M.2.SL.TZ2.4d:
It is found that of the cats weigh more than . Estimate the value of .
-
21M.2.AHL.TZ2.4c:
Find a matrix , with integer elements, such that , where is a diagonal matrix.
-
21M.2.AHL.TZ2.4d:
Hence, show that the long-term transition matrix is given by .
-
21M.2.AHL.TZ2.4e:
Hence, or otherwise, determine the expected ratio of the number of patients Doctor Black would have compared to Doctor Green in the long term.
-
21N.1.AHL.TZ0.14c:
The sacks of potatoes are transported in crates. There are sacks in each crate and the weights of the sacks of potatoes are independent of each other.
Find the probability that the total weight of the sacks of potatoes in a crate exceeds .
-
21N.2.SL.TZ0.5d.i:
Find the probability that Arianne scores at least points in the competition.
-
EXN.2.AHL.TZ0.3b:
Find the value of and the value of , giving your answers correct to one decimal place.
-
21N.2.AHL.TZ0.3d.iv:
Given that Arianne scores at least points, find the probability that Arianne scores less than points.
-
21N.2.SL.TZ0.5a.i:
a dart lands less than from .
-
21N.2.SL.TZ0.5a.ii:
a dart lands more than from .
-
21N.2.SL.TZ0.5c:
Find the probability that Arianne does not score a point on a turn of three darts.
-
21N.2.SL.TZ0.5d.ii:
Find the probability that Arianne scores at least points and less than points.
-
21N.2.SL.TZ0.5d.iii:
Given that Arianne scores at least points, find the probability that Arianne scores less than points.
-
21N.2.AHL.TZ0.3a.i:
a dart lands less than from .
-
21N.2.AHL.TZ0.3a.ii:
a dart lands more than from .
-
21N.2.AHL.TZ0.3c:
Find the probability that Arianne does not score a point on a turn of three darts.
-
21N.2.AHL.TZ0.3d.i:
Find Arianne’s expected score in the competition.
-
21N.2.AHL.TZ0.3d.ii:
Find the probability that Arianne scores at least points in the competition.
-
21N.2.AHL.TZ0.3d.iii:
Find the probability that Arianne scores at least points and less than points.