| Date | May 2017 | Marks available | 2 | Reference code | 17M.1.SL.TZ1.S_6 |
| Level | Standard Level | Paper | Paper 1 | Time zone | Time zone 1 |
| Command term | Determine and Justify | Question number | S_6 | Adapted from | N/A |
Question
The following diagram shows the graph of , the derivative of .
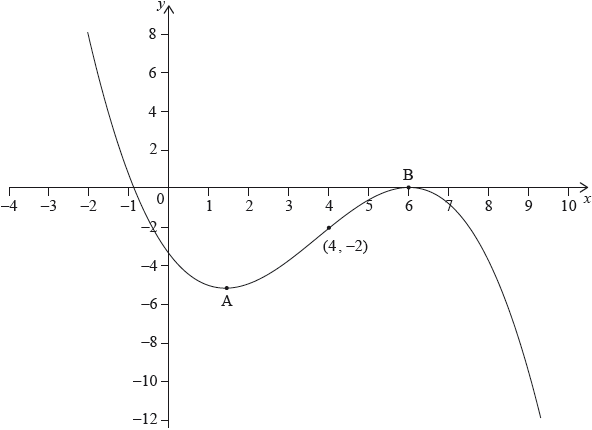
The graph of has a local minimum at A, a local maximum at B and passes through .
The point lies on the graph of the function, .
Write down the gradient of the curve of at P.
Find the equation of the normal to the curve of at P.
Determine the concavity of the graph of when and justify your answer.
Markscheme
A1 N1
[1 mark]
gradient of normal (A1)
attempt to substitute their normal gradient and coordinates of P (in any order) (M1)
eg
A1 N3
[3 marks]
correct answer and valid reasoning A2 N2
answer: eg graph of is concave up, concavity is positive (between )
reason: eg slope of is positive, is increasing, ,
sign chart (must clearly be for and show A and B)
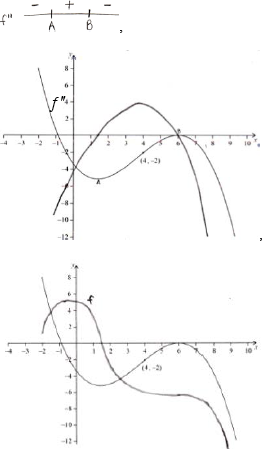
Note: The reason given must refer to a specific function/graph. Referring to “the graph” or “it” is not sufficient.
[2 marks]
Examiners report
Syllabus sections
-
22M.2.AHL.TZ1.3a:
Name the type of sampling that best describes the method used by the Principal.
-
22M.2.SL.TZ1.3b:
Determine if the Netherlands’ score is an outlier for this data. Justify your answer.
-
19M.2.AHL.TZ1.H_3b.ii:
the standard deviation.
-
18N.2.AHL.TZ0.H_10b.ii:
an estimate for the standard deviation of the number of emails received per working day.
-
EXM.2.SL.TZ0.5d:
State an assumption that the company is making, in order to use a t-test.
-
EXM.2.SL.TZ0.5c.i:
The new drug.
-
EXM.2.SL.TZ0.5b:
Calculate the number of volunteers in the sample under the age of 30.
-
17M.1.SL.TZ1.S_9c:
The line is a tangent to the curve of . Find the values of .
-
18N.2.AHL.TZ0.H_10d:
Suppose that the probability of Archie receiving more than 10 emails in total on any one day is 0.99. Find the value of λ.
-
EXM.2.SL.TZ0.5e:
State the hypotheses for this t-test.
-
22M.1.SL.TZ2.7a:
Show that the test score of would not be considered an outlier.
-
18M.1.AHL.TZ2.H_3b.i:
Find μ, the expected value of X.
-
18N.2.AHL.TZ0.H_10a.ii:
Using this distribution model, find the standard deviation of .
-
18N.2.AHL.TZ0.H_10b.i:
an estimate for the mean number of emails received per working day.
-
19M.2.SL.TZ1.S_9b:
Find u.
-
18M.1.SL.TZ1.S_2a:
Find the value of the interquartile range.
-
17M.1.SL.TZ1.S_6a.i:
Write down the gradient of the curve of at P.
-
17M.2.SL.TZ2.S_8b.i:
Write down the coordinates of A.
-
EXM.2.SL.TZ0.5f:
Find the p-value for this t-test.
-
EXM.2.SL.TZ0.5c.ii:
The current drug.
-
EXM.1.SL.TZ0.5c:
Give an example of a set of data with 7 numbers in it that does have an outlier, justify this fact by stating the Interquartile Range.
-
19M.1.SL.TZ2.S_9d:
The following diagram shows the graph of for 0 ≤ ≤ 3. Line is a tangent to the graph of at point P.

Given that is parallel to , find the -coordinate of P.
-
18M.1.AHL.TZ2.H_3b.ii:
Find P(X > μ).
-
SPM.1.SL.TZ0.3b:
Find the value of .
-
EXM.2.SL.TZ0.5g:
State the conclusion of this test, in context, giving a reason.
-
17N.1.SL.TZ0.S_5a:
Find .
-
19M.2.SL.TZ1.S_9d.iii:
Hence or otherwise, find the obtuse angle formed by the tangent line to at and the tangent line to at .
-
17M.2.SL.TZ2.S_8b.ii:
Write down the rate of change of at A.
-
18N.2.AHL.TZ0.H_10a.i:
Using this distribution model, find .
-
18M.1.SL.TZ1.S_2b:
One student sent k text messages, where k > 11 . Given that k is an outlier, find the least value of k.
-
18N.2.AHL.TZ0.H_10e:
Now suppose that Archie received exactly 20 emails in total in a consecutive two day period. Show that the probability that he received exactly 10 of them on the first day is independent of λ.
-
19M.2.SL.TZ1.S_9d.i:
Find .
-
17M.2.SL.TZ2.S_8c.i:
Find the coordinates of B.
-
18N.2.AHL.TZ0.H_10c:
Give one piece of evidence that suggests Willow’s Poisson distribution model is not a good fit.
-
19M.2.SL.TZ1.S_9c:
Find the acute angle between and .
-
18N.1.SL.TZ0.S_10b.ii:
Hence, find the equation of L in terms of .
-
18N.1.SL.TZ0.S_10a:
Find the coordinates of P.
-
16N.2.SL.TZ0.S_10a:
(i) Find the value of .
(ii) Show that .
(iii) Find the value of .
-
EXM.2.SL.TZ0.5a:
State the name for this type of sampling technique.
-
SPM.1.SL.TZ0.3a:
State whether the data is discrete or continuous.
-
17M.1.SL.TZ1.S_9b:
Find the value of .
-
16N.2.AHL.TZ0.H_11d:
(i) Hence show that has two modes and .
(ii) State the values of and .
-
18N.1.SL.TZ0.S_10b.i:
Find .
-
17M.1.SL.TZ1.S_6a.ii:
Find the equation of the normal to the curve of at P.
-
19M.1.SL.TZ2.S_9b:
Line passes through the origin and has a gradient of . Find the equation of .
-
17M.1.SL.TZ1.S_9a:
Find the value of .
-
19M.1.SL.TZ2.S_9a:
Find the value of .
-
18N.1.SL.TZ0.S_10c:
The graph of has a local minimum at the point Q. The line L passes through Q.
Find the value of .
-
16N.2.AHL.TZ0.H_11b:
Find the values of the constants and .
-
16N.2.AHL.TZ0.H_11a:
Show that and .
-
18N.2.SL.TZ0.S_10c:
When = 0, the volume of water in the container is 2.3 m3. It is known that the container is never completely full of water during the 4 hour period.
Find the minimum volume of empty space in the container during the 4 hour period.
-
19M.1.SL.TZ2.S_9c:
Find the derivative of .
-
EXN.1.SL.TZ0.1b:
The Principal selects the students for the sample by asking those who took part in a previous survey if they would like to take part in another. She takes the first of those who reply positively, up to the maximum needed for the sample.
State which two of the sampling methods listed below best describe the method used.
Stratified Quota Convenience Systematic Simple random
-
16N.2.SL.TZ0.S_10b:
(i) Write down the value of .
(ii) Find .
-
17M.2.SL.TZ2.S_8d:
Let be the region enclosed by the graph of , the -axis, the line and the line . The region is rotated 360° about the -axis. Find the volume of the solid formed.
-
EXM.1.SL.TZ0.5b:
Hence, show that a data set with only 5 numbers in it cannot have any outliers.
-
17M.2.SL.TZ2.S_8a:
Find the value of .
-
SPM.1.SL.TZ0.3c:
It was not possible to ask every person in the school, so the Headmaster arranged the student names in alphabetical order and then asked every 10th person on the list.
Identify the sampling technique used in the survey.
-
18N.2.SL.TZ0.S_10a:
Find the volume of the container.
-
19M.2.SL.TZ1.S_3a:
Find .
-
21M.2.SL.TZ1.1d:
Determine whether Jason is correct. Support your reasoning.
-
21M.1.AHL.TZ1.11a:
Identify the type of sampling used by the restaurant manager.
-
16N.2.AHL.TZ0.H_11e:
Determine the minimum value of such that the probability Kati receives at least one free gift is greater than 0.5.
-
18N.2.SL.TZ0.S_10b.ii:
During the interval < < , he volume of water in the container increases by m3. Find the value of .
-
EXM.1.SL.TZ0.5a:
Recalling definitions, such as the Lower Quartile is the piece of data with the data placed in order, find an expression for the Interquartile Range.
-
17N.1.SL.TZ0.S_5b:
Given that , find the value of .
-
19M.2.SL.TZ1.S_9a:
Find the gradient of .
-
19M.2.SL.TZ1.S_3b:
The graph of has a horizontal tangent line at and at . Find .
-
19M.2.SL.TZ1.S_9d.ii:
Hence, write down .
-
21M.2.SL.TZ1.1a:
State which of the two sampling methods, systematic or quota, Jason has used.
-
18M.1.AHL.TZ2.H_3a:
Find the value of p.
-
18N.2.SL.TZ0.S_10b.i:
Find the value of and of .
-
16N.2.SL.TZ0.S_10c:
(i) Find .
(ii) Hence or otherwise, find the maximum positive rate of change of .
-
21M.3.AHL.TZ1.2b:
Show that employees are selected for the sample from the national department.
-
21M.2.SL.TZ2.1a:
State the sampling method being used.
-
16N.2.AHL.TZ0.H_11c:
Deduce that for .
-
21M.3.AHL.TZ2.1b:
Juliet classifies response as an outlier and removes it from the data. Suggest one possible justification for her decision to remove it.
-
EXN.1.SL.TZ0.1a:
Calculate the number of grade students who should be in the sample.
-
17M.2.SL.TZ2.S_8c.ii:
Find the the rate of change of at B.
-
18M.1.SL.TZ1.S_7:
Consider f(x), g(x) and h(x), for x∈ where h(x) = (x).
Given that g(3) = 7 , g′ (3) = 4 and f ′ (7) = −5 , find the gradient of the normal to the curve of h at x = 3.