| Date | November 2016 | Marks available | 2 | Reference code | 16N.2.SL.TZ0.T_1 |
| Level | Standard Level | Paper | Paper 2 | Time zone | Time zone 0 |
| Command term | Estimate | Question number | T_1 | Adapted from | N/A |
Question
In the month before their IB Diploma examinations, eight male students recorded the number of hours they spent on social media.
For each student, the number of hours spent on social media () and the number of IB Diploma points obtained () are shown in the following table.
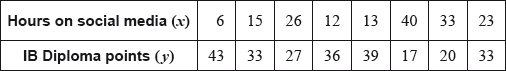
Use your graphic display calculator to find
Ten female students also recorded the number of hours they spent on social media in the month before their IB Diploma examinations. Each of these female students spent between 3 and 30 hours on social media.
The equation of the regression line y on x for these ten female students is
An eleventh girl spent 34 hours on social media in the month before her IB Diploma examinations.
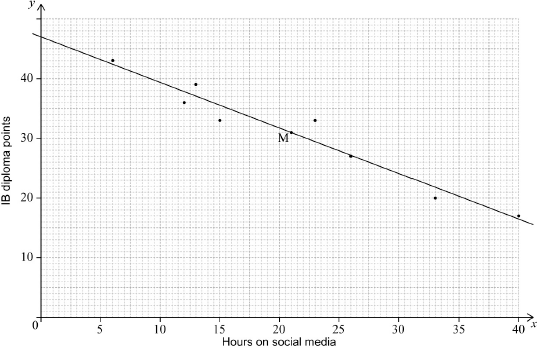
On graph paper, draw a scatter diagram for these data. Use a scale of 2 cm to represent 5 hours on the -axis and 2 cm to represent 10 points on the -axis.
(i) , the mean number of hours spent on social media;
(ii) , the mean number of IB Diploma points.
Plot the point on your scatter diagram and label this point M.
Write down the equation of the regression line on for these eight male students.
Draw the regression line, from part (e), on your scatter diagram.
Use the given equation of the regression line to estimate the number of IB Diploma points that this girl obtained.
Write down a reason why this estimate is not reliable.
Markscheme
* This question is from an exam for a previous syllabus, and may contain minor differences in marking or structure.
 (A4)
(A4)
Notes: Award (A1) for correct scale and labelled axes.
Award (A3) for 7 or 8 points correctly plotted,
(A2) for 5 or 6 points correctly plotted,
(A1) for 3 or 4 points correctly plotted.
Award at most (A0)(A3) if axes reversed.
Accept and sufficient for labelling.
If graph paper is not used, award (A0).
If an inconsistent scale is used, award (A0). Candidates’ points should be read from this scale where possible and awarded accordingly.
A scale which is too small to be meaningful (ie mm instead of cm) earns (A0) for plotted points.
[4 marks]
(i) (A1)
(ii) (A1)
[2 marks]
correctly plotted on graph (A1)(ft)
this point labelled M (A1)
Note: Follow through from parts (b)(i) and (b)(ii).
Only accept M for labelling.
[2 marks]
(A1)(A1)(G2)
Notes: Award (A1) for and (A1) . Award a maximum of (A1)(A0) if answer is not an equation.
[2 marks]
line on graph (A1)(ft)(A1)(ft)
Notes: Award (A1)(ft) for straight line that passes through their M, (A1)(ft) for line (extrapolated if necessary) that passes through .
If M is not plotted or labelled, follow through from part (e).
[2 marks]
(M1)
Note: Award (M1) for correct substitution.
19 (points) (A1)(G2)
[2 marks]
extrapolation (R1)
OR
34 hours is outside the given range of data (R1)
Note: Do not accept ‘outlier’.
[1 mark]
Examiners report
Syllabus sections
-
22M.2.AHL.TZ1.3b.i:
the mean mark.
-
22M.2.AHL.TZ1.3b.ii:
the standard deviation of the marks.
-
22M.2.SL.TZ2.1b:
Find the estimated number of teenagers who have a reaction time greater than seconds.
-
22M.2.SL.TZ2.1d.ii:
Write down the value of .
-
22M.2.SL.TZ2.1f:
Use your graphic display calculator to find an estimate of the mean reaction time.
-
22M.2.SL.TZ2.1g:
Suggest how, if at all, the estimated mean and estimated median reaction times will change if the errors are corrected. Justify your response.
-
22M.2.SL.TZ1.3a.ii:
the interquartile range.
-
19M.2.AHL.TZ1.H_3b.ii:
the standard deviation.
-
18M.1.SL.TZ1.T_2b.ii:
Find the interquartile range.
-
18N.2.AHL.TZ0.H_10b.ii:
an estimate for the standard deviation of the number of emails received per working day.
-
17M.1.SL.TZ2.S_8b.i:
Find the amount of money an employee earned for working 40 hours;
-
18M.2.SL.TZ2.T_2e:
Find the number of buses that travelled a distance less than or equal to 12 000 km.
-
18M.2.SL.TZ2.T_2g:
The smallest distance travelled by one of the buses was 2500 km.
The longest distance travelled by one of the buses was 23 000 km.On graph paper, draw a box-and-whisker diagram for these data. Use a scale of 2 cm to represent 5000 km.
-
19M.1.SL.TZ2.T_14b:
Find the probability that the price of a kilogram of tomatoes, chosen at random, will be between 2.00 and 3.00 euro.
-
18M.1.SL.TZ1.T_2b.i:
Find the standard deviation
-
18M.2.SL.TZ1.T_2g:
Given that this flight was not heavily delayed, find the probability that it travelled between 500 km and 5000 km.
-
19N.1.SL.TZ0.T_13c:
Use your graphic display calculator to find an estimate for the standard deviation of the weight of the eggs.
-
19N.1.SL.TZ0.T_13b:
Write down the modal grade of the eggs.
-
18N.2.AHL.TZ0.H_10d:
Suppose that the probability of Archie receiving more than 10 emails in total on any one day is 0.99. Find the value of λ.
-
17N.1.SL.TZ0.T_1b:
Draw a box-and-whisker diagram, for these students’ ages, on the following grid.
-
18M.1.SL.TZ1.T_2a:
Find the value of x.
-
22M.2.SL.TZ2.1a.ii:
interquartile range of the reaction times.
-
22M.2.SL.TZ2.1c:
Determine the percentile of the reaction times from the cumulative frequency graph.
-
22M.2.SL.TZ2.1d.i:
Write down the value of .
-
22M.2.SL.TZ2.1e:
Write down the modal class from the table.
-
19M.2.SL.TZ1.T_3i:
State the conclusion for this test. Give a reason for your answer.
-
22M.2.SL.TZ1.3a.i:
the upper quartile.
-
22M.1.SL.TZ2.7b:
With reference to the box and whisker diagrams, state one aspect that may support the researcher’s opinion and one aspect that may counter it.
-
21N.1.AHL.TZ0.14a:
Find the probability that a sack is under its labelled weight.
-
21N.1.AHL.TZ0.14b:
Find the lower quartile of the weights of the sacks of potatoes.
-
18M.1.AHL.TZ2.H_3b.i:
Find μ, the expected value of X.
-
18N.2.AHL.TZ0.H_10a.ii:
Using this distribution model, find the standard deviation of .
-
18N.2.AHL.TZ0.H_10b.i:
an estimate for the mean number of emails received per working day.
-
18M.2.SL.TZ2.T_2f:
Find the value of m.
-
18M.1.SL.TZ1.S_2a:
Find the value of the interquartile range.
-
18M.2.SL.TZ1.T_2d.ii:
Write down the associated p-value.
-
17N.2.SL.TZ0.T_1b.ii:
Write down, for , the mid-interval value of the modal class.
-
18M.2.SL.TZ2.T_2d:
Write down the percentage of buses that travelled a distance greater than the upper quartile.
-
16N.2.SL.TZ0.T_1h:
Write down a reason why this estimate is not reliable.
-
17M.2.SL.TZ1.T_5a.ii:
Calculate the standard deviation.
-
17M.2.SL.TZ1.T_5b:
Find the median test grade of the students.
-
19M.2.SL.TZ1.T_3f:
Write down the number of degrees of freedom for this test.
-
19M.1.SL.TZ2.T_14a.i:
On the following diagram, shade the region representing the probability that the price of a kilogram of tomatoes, chosen at random, will be higher than 3.22 euro.

-
19M.1.SL.TZ2.T_14a.ii:
Find the price that is two standard deviations above the mean price.
-
19M.1.SL.TZ2.T_14c:
To stimulate reasonable pricing, the city offers a free permit to the sellers whose price of a kilogram of tomatoes is in the lowest 20 %.
Find the highest price that a seller can charge and still receive a free permit.
-
19M.1.SL.TZ2.T_6c:
The health inspector visits two school cafeterias. She inspects the same number of meals at each cafeteria. The data is shown in the following box-and-whisker diagrams.

Meals prepared in the school cafeterias are required to have less than 10 grams of sugar.
State, giving a reason, which school cafeteria has more meals that do not meet the requirement.
-
17N.1.SL.TZ0.T_1a.ii:
For the students in this group write down the median age.
-
19M.2.SL.TZ1.T_3a:
Write down the total number of people, from this group, who are pet owners.
-
18M.1.AHL.TZ2.H_3b.ii:
Find P(X > μ).
-
19M.2.SL.TZ1.T_3b:
Write down the modal number of pets.
-
SPM.1.SL.TZ0.3b:
Find the value of .
-
17M.1.SL.TZ2.T_7c:
Find the value of and of .
-
18M.2.SL.TZ1.T_2d.i:
Write down the χ2 statistic.
-
18M.2.SL.TZ2.T_2b.ii:
Use the cumulative frequency curve to find the lower quartile.
-
18M.2.SL.TZ1.T_2a:
State the alternative hypothesis.
-
17N.2.SL.TZ0.T_1c.i:
Use your graphic display calculator to estimate the mean of ;
-
17N.2.SL.TZ0.T_1f.ii:
Write down the statistic.
-
17M.1.SL.TZ2.S_8a.ii:
Write down the number of employees who worked 50 hours or less.
-
19M.2.SL.TZ1.T_3g:
Calculate the expected number of teenagers that prefer cats.
-
18M.2.SL.TZ1.T_2c:
Write down the number of degrees of freedom.
-
18N.2.AHL.TZ0.H_10a.i:
Using this distribution model, find .
-
17M.2.SL.TZ1.T_5e:
Given that the first student chosen at random scored a grade 5 or higher, find the probability that both students scored a grade 6.
-
19M.2.SL.TZ1.T_3c.iii:
For these data, write down the upper quartile.
-
19M.2.SL.TZ1.T_3d:
Write down the ratio of teenagers to non-teenagers in its simplest form.
-
16N.2.SL.TZ0.T_1f:
Draw the regression line, from part (e), on your scatter diagram.
-
18M.1.SL.TZ1.S_2b:
One student sent k text messages, where k > 11 . Given that k is an outlier, find the least value of k.
-
17M.2.SL.TZ1.T_5c:
Find the interquartile range.
-
17N.2.SL.TZ0.T_1e.ii:
Write down the number of degrees of freedom.
-
17N.2.SL.TZ0.T_1b.i:
Write down, for , the modal class;
-
18N.2.AHL.TZ0.H_10e:
Now suppose that Archie received exactly 20 emails in total in a consecutive two day period. Show that the probability that he received exactly 10 of them on the first day is independent of λ.
-
17N.2.SL.TZ0.T_1a:
State whether is a discrete or a continuous variable.
-
17N.2.SL.TZ0.T_1c.ii:
Use your graphic display calculator to estimate the standard deviation of .
-
19N.1.SL.TZ0.T_13a:
State whether the weight of the eggs is a continuous or discrete variable.
-
18N.2.AHL.TZ0.H_10c:
Give one piece of evidence that suggests Willow’s Poisson distribution model is not a good fit.
-
17M.1.SL.TZ2.T_7a:
Write down an equation, in terms of and , for the total number of times the die was rolled.
-
SPM.1.SL.TZ0.3a:
State whether the data is discrete or continuous.
-
18M.1.SL.TZ1.T_6c.i:
Write down the mid-interval value for the 100 < x ≤ 150 group.
-
16N.2.SL.TZ0.S_8b:
During week 2, the students worked on a major project and they each spent an additional five hours browsing the Internet. For week 2, write down
(i) the mean;
(ii) the standard deviation.
-
18M.1.SL.TZ2.T_12a:
Write down the mid-interval value for 10 ≤ t < 15.
-
18M.1.SL.TZ2.T_12b.i:
Write down the total number of customers in terms of k.
-
19M.2.SL.TZ1.T_3e.ii:
State the alternative hypothesis.
-
16N.2.AHL.TZ0.H_11d:
(i) Hence show that has two modes and .
(ii) State the values of and .
-
18M.2.SL.TZ2.T_2a:
Find the number of buses that travelled a distance between 15000 and 20000 kilometres.
-
16N.2.SL.TZ0.T_1a:
On graph paper, draw a scatter diagram for these data. Use a scale of 2 cm to represent 5 hours on the -axis and 2 cm to represent 10 points on the -axis.
-
17N.2.SL.TZ0.T_1f.i:
Write down the -value for the test;
-
17N.2.SL.TZ0.T_1e.i:
Write down the null hypothesis for this test;
-
16N.2.AHL.TZ0.H_11b:
Find the values of the constants and .
-
16N.2.AHL.TZ0.H_11a:
Show that and .
-
17N.2.SL.TZ0.T_1g:
State the result of the test. Give a reason for your answer.
-
18M.2.SL.TZ2.T_2c:
Hence write down the interquartile range.
-
17M.1.SL.TZ2.T_7b:
Using the mean score, write down a second equation in terms of and .
-
18M.2.SL.TZ2.T_2b.i:
Use the cumulative frequency curve to find the median distance.
-
18M.2.SL.TZ2.T_2b.iii:
Use the cumulative frequency curve to find the upper quartile.
-
20N.1.SL.TZ0.S_8a:
Find the value of .
-
20N.2.SL.TZ0.S_9d:
Find the probability that Fiona will arrive on time.
-
20N.1.SL.TZ0.T_3b:
Use your graphic display calculator to find an estimate of the standard deviation of the weights of mangoes from this harvest.
-
20N.1.SL.TZ0.T_3c:
On the grid below, draw a histogram for the data in the table.

-
20N.1.SL.TZ0.T_7b:
Using this information, write down an equation in and .
-
20N.1.SL.TZ0.T_7d.ii:
Using your answers to parts (b) and (c), find the height of Flower .
-
17N.2.SL.TZ0.T_1d:
Find the expected frequency of students choosing the Science category and obtaining 31 to 40 correct answers.
-
20N.1.SL.TZ0.S_8b:
Write down the value of the median distance in kilometres (km).
-
20N.1.SL.TZ0.S_8d:
Find .
-
20N.2.SL.TZ0.S_9c:
Find the probability that the bus journey takes less than minutes.
-
20N.2.SL.TZ0.S_9e:
This year, Fiona will go to school on days.
Calculate the number of days Fiona is expected to arrive on time.
-
16N.1.SL.TZ0.T_2b:
Draw a box-and-whisker diagram on the grid below to represent the Vitamin C content, in milligrams, for this sample.
-
16N.2.SL.TZ0.T_1b:
(i) , the mean number of hours spent on social media;
(ii) , the mean number of IB Diploma points.
-
SPM.1.SL.TZ0.3c:
It was not possible to ask every person in the school, so the Headmaster arranged the student names in alphabetical order and then asked every 10th person on the list.
Identify the sampling technique used in the survey.
-
21M.1.SL.TZ1.2b:
the mean.
-
19M.2.SL.TZ1.T_3e.i:
State the null hypothesis.
-
16N.2.SL.TZ0.S_8a:
Find the mean number of hours spent browsing the Internet.
-
21M.1.SL.TZ1.2a:
the mode.
-
21M.1.SL.TZ1.2c:
the standard deviation.
-
16N.2.AHL.TZ0.H_11e:
Determine the minimum value of such that the probability Kati receives at least one free gift is greater than 0.5.
-
18M.2.SL.TZ1.T_2e:
State, with a reason, whether you would reject the null hypothesis.
-
17M.2.SL.TZ1.T_5f.ii:
Calculate the expected number of students that spent at least 90 minutes preparing for the test.
-
20N.2.SL.TZ0.S_9b:
Find .
-
20N.1.SL.TZ0.T_7d.i:
Using your answers to parts (b) and (c), find the height of Flower .
-
19M.2.SL.TZ1.T_3c.i:
For these data, write down the median number of pets.
-
19M.2.SL.TZ1.T_3c.ii:
For these data, write down the lower quartile.
-
20N.1.SL.TZ0.S_8c:
Find the value of .
-
16N.2.SL.TZ0.T_1c:
Plot the point on your scatter diagram and label this point M.
-
20N.1.SL.TZ0.T_3a:
Write down the modal group for these data.
-
20N.1.SL.TZ0.S_8e:
The first athletes that completed the race won a prize.
Given that an athlete took between and minutes to complete the race, calculate the probability that they won a prize.
-
17M.2.SL.TZ1.T_5a.i:
Calculate the mean test grade of the students;
-
17M.2.SL.TZ1.T_5d:
Find the probability that this student scored a grade 5 or higher.
-
18M.2.SL.TZ1.T_2b:
Calculate the expected frequency of flights travelling at most 500 km and arriving slightly delayed.
-
18M.1.AHL.TZ2.H_3a:
Find the value of p.
-
16N.2.SL.TZ0.S_8d:
(i) Find the number of students who spent between 25 and 30 hours browsing the Internet.
(ii) Given that 10% of the students spent more than k hours browsing the Internet, find the maximum value of .
-
16N.2.SL.TZ0.T_1e:
Write down the equation of the regression line on for these eight male students.
-
18M.2.SL.TZ1.T_2f:
Write down the probability that this flight arrived on time.
-
18M.2.SL.TZ1.T_2h:
Two flights are chosen at random from those which were slightly delayed.
Find the probability that each of these flights travelled at least 5000 km.
-
16N.2.AHL.TZ0.H_11c:
Deduce that for .
-
20N.1.SL.TZ0.T_7c:
Write down a second equation in and .
-
19N.1.SL.TZ0.T_13d:
The mean weight of these eggs is 64.9 grams, correct to three significant figures.
Use the table and your answer to part (c) to find the smallest possible number of eggs that could be within one standard deviation of the mean.
-
17M.2.SL.TZ1.T_5f.i:
Calculate the probability that a student chosen at random spent at least 90 minutes preparing for the test.
-
20N.2.SL.TZ0.S_9a:
Find the probability that it will take Fiona between minutes and minutes to walk to the bus stop.
-
16N.2.SL.TZ0.S_8c:
During week 3 each student spent 5% less time browsing the Internet than during week 1. For week 3, find
(i) the median;
(ii) the variance.
-
21N.1.SL.TZ0.9c.i:
Find the number of students who obtained a grade .
-
21N.1.AHL.TZ0.14c:
The sacks of potatoes are transported in crates. There are sacks in each crate and the weights of the sacks of potatoes are independent of each other.
Find the probability that the total weight of the sacks of potatoes in a crate exceeds .
-
21N.1.SL.TZ0.9a:
Find the median of the scores obtained.
-
21N.1.SL.TZ0.9b:
Find an expression for in terms of .
-
21N.1.SL.TZ0.9c.ii:
Find the minimum score needed to obtain a grade .
-
20N.1.SL.TZ0.T_7a:
Find the height of Flower .