DP Physics (last assessment 2024)
Question 18M.1.HL.TZ1.38
| Date | May 2018 | Marks available | [Maximum mark: 1] | Reference code | 18M.1.HL.TZ1.38 |
| Level | HL | Paper | 1 | Time zone | TZ1 |
| Command term | Question number | 38 | Adapted from | N/A |
38.
[Maximum mark: 1]
18M.1.HL.TZ1.38
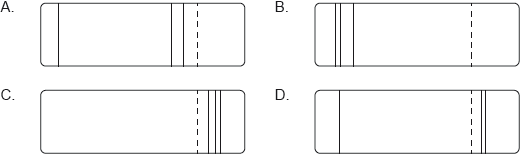
According to the Bohr model for hydrogen, visible light is emitted when electrons make transitions from excited states down to the state with n = 2. The dotted line in the following diagram represents the transition from n = 3 to n = 2 in the spectrum of hydrogen.

Which of the following diagrams could represent the visible light emission spectrum of hydrogen?
[1]
Markscheme
B