DP Chemistry (first assessment 2025)
Question 19M.2.SL.TZ1.4b(iii)
| Date | May 2019 | Marks available | [Maximum mark: 2] | Reference code | 19M.2.SL.TZ1.4b(iii) |
| Level | SL | Paper | 2 | Time zone | TZ1 |
| Command term | Sketch | Question number | b(iii) | Adapted from | N/A |
b(iii).
[Maximum mark: 2]
19M.2.SL.TZ1.4b(iii)
(b(iii))
Additional experiments were carried out at an elevated temperature. On the axes below, sketch Maxwell–Boltzmann energy distribution curves at two temperatures T1 and T2, where T2 > T1.
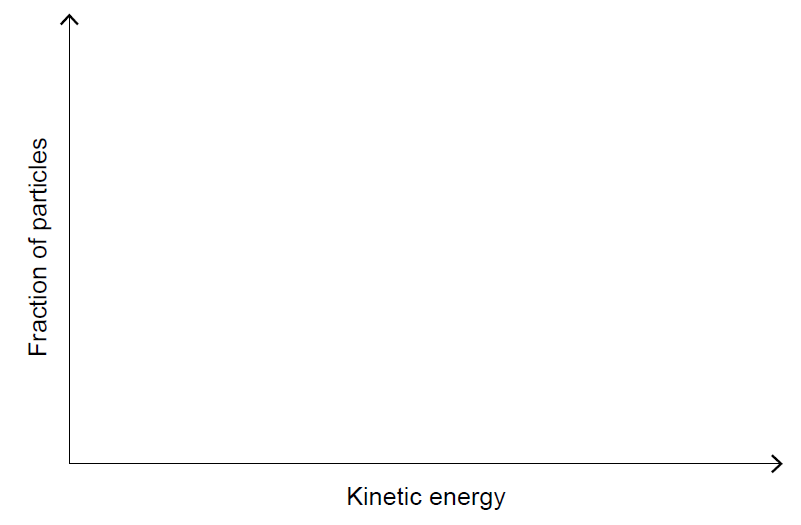
[2]
Markscheme

peak of T2 to right of AND lower than T1 [✔]
lines begin at origin AND T2 must finish above T1 [✔]
Examiners report
Fair performance; errors including not starting the two curves at the origin, drawing peak for T2 above T1, T2 finishing below T1 or curves crossing the x-axis.
Syllabus sections
Reactivity 2. How much, how fast and how far? » Reactivity 2.2—How fast? The rate of chemical change » Reactivity 2.2.4—Activation energy, Ea, is the minimum energy that colliding particles need for a successful collision leading to a reaction. Construct Maxwell–Boltzmann energy distribution curves to explain the effect of temperature on the probability of successful collisions.