Gases 1
What is the temperature of a gas represented on a pV graph?
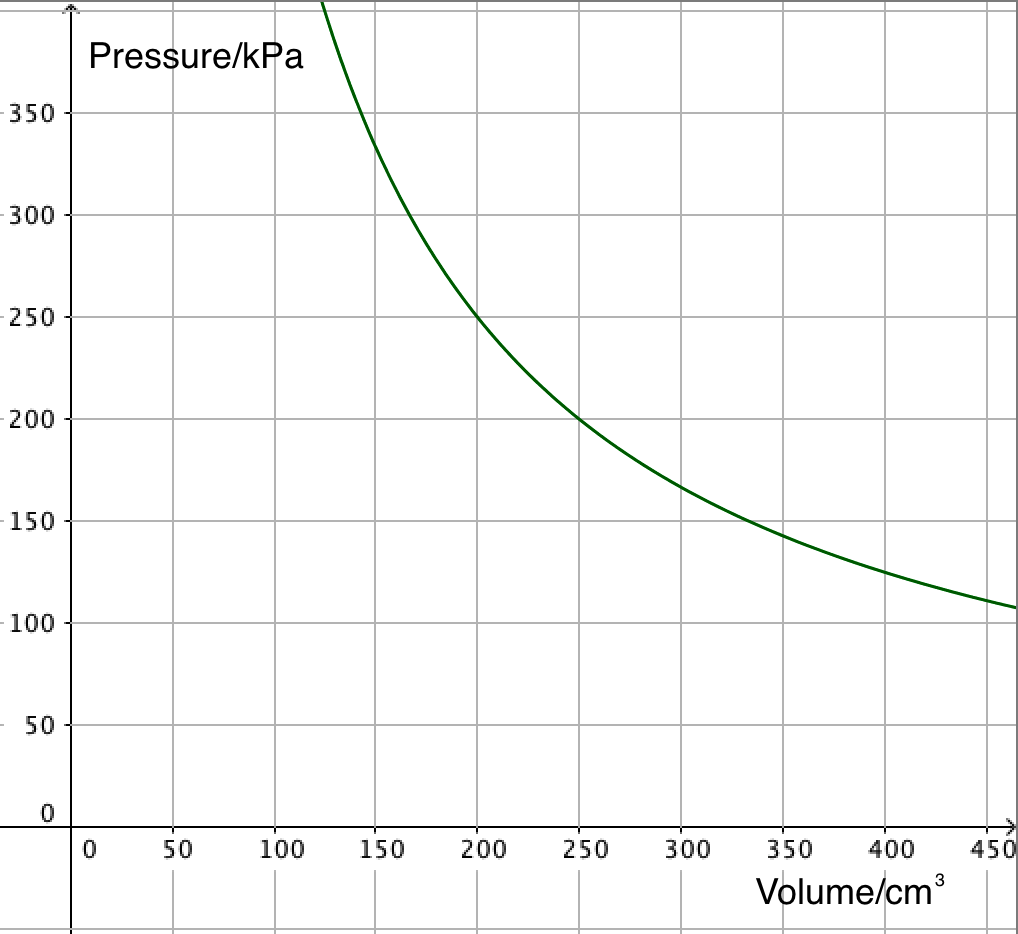
The pressure of 0.001 moles of gas is measured as its volume is reduced. The results are plotted and the best fit line below obtained.
Show that the temperature is constant and find its value.
Next