
Statistics & Probability Exam Questions
 The following are exam style questions for the sub-topics in the functions unit. There are questions with video solutions here for here for Statistical concepts, cumulative frequency and box plots, central tendency and dispersion, bivariate data and linear correlation, probability, discrete random variables, binomial distribution, normal distribution, spearman's rank and chi squared tests!
The following questions are based on IB exam style questions from past exams. You should print these off (from the document at the top) and try to do these questions under exam conditions. Then you can check your work with the video solution.
A headteacher wants to find out in how many subjects students have Internal Assessments (IA). He conducts a survey:
| Number of subjects with IAs | 0 | 1 | 2 | 3 | 4 | 5 | 6 |
| Number of students | 15 | 20 | 20 | 32 | 30 | 17 | 16 |
-
State whether the data is discrete or continuous (1)
-
It was not possible to ask the whole school, so he conducts a survey. The school is 55% boys and 45% girls, so he makes sure his sample includes 55% boys and 45% girls. What type of sampling does he use? (1)
-
He then wants to investigate further, so asks all the students that are studying Geography. What type of sampling is this? (1)
-
The coursework marks of the students studying Geography are listed below.
-
Identify the outlier
-
By removing the outlier, calculate the new mean (3)
-
| 45% | 39% | 46% | 29% | 39% | 43% | 42% | 48% | 39% | 41% |
(6 marks)
Video Solution
The following questions are based on IB exam style questions from past exams. You should print these off (from the document at the top) and try to do these questions under exam conditions. Then you can check your work with the video solution.
The table below shows the number of languages a class of 25 children speak
| No of languages | 1 | 2 | 3 | 4 | 5 |
| Frequency | 7 | p | 6 | 3 | 1 |
-
Find the value of p
(1)
-
Use your graphical display calculator to find
-
The median number of languages spoken
-
The mean number of languages spoken
-
The standard deviation of the number of languages spoken
-
(3)
-
Showing your working, identify any outliers in this data.
(2)
(6 marks)
Video solution
10 dogs were weighed and their results written down in kilograms. The following box and whisker plot was used to represent their weights.
a) Write down
(i) the median weight;
(ii) the 75th percentile weight;
(iii) the range of marks.
(4)
b) How many dogs weighed more than 39 kg?
(2)
The mean weight of the dogs was found to be 40.5kg, and the standard deviation 13.8. After being put on a strict exercise routine, all the dogs had lost 2kg the next time they were weighed.
c) What is the new mean and standard deviation of the dogs?
(2)
(Total 8 marks)
Video solution
The following questions are based on IB exam style questions from past exams. You should print these off (from the document at the top) and try to do these questions under exam conditions. Then you can check your work with the video solution.
The following questions are based on IB exam style questions from past exams. You should print these off (from the document at the top) and try to do these questions under exam conditions. Then you can check your work with the video solution.
Video solution
Ross and Dylan are playing padel. The probability that Dylan wins the first game is 0.6. If Ross wins the game the probability that he wins the next game is 0.9. If Dylan wins the game, the probability that he wins the next game is 0.5. Let R be the probability that Ross wins a game, and D be the probability that Dylan wins the game.
a. Complete the tree diagram to represent the padel game.
b. Find the probability that Dylan wins both games
c. Find the probability that Ross wins the second game, given that he wins the first game.
Video Solution
The following questions are based on IB exam style questions from past exams. You should print these off (from the document at the top) and try to do these questions under exam conditions. Then you can check your work with the video solution.
Jenni plays a game using a spinner. The values on the spinner are labelled -5,0,3 and 10. The score for the game, X, is the value the spinner lands on. The following table shows the probability distribution for X.
| Score X | -5 | 0 | 3 | 10 |
| P(X=x) | 0.29 | a | 0.39 | 0.19 |
-
What is the value of a?
(1)
-
What is Jenni’s expected score if she plays the game once?
(2)
Jenni plays this game at a fair, and wins the amount in $ that the spinner lands on.
-
What would be a fair price for Jenni to pay?
(1)
-
Jenni plays the game twice and adds up her scores. What is the probability that she gets a total score of 3?
(3)
(7 marks)
Video solution
The following questions are based on IB exam style questions from past exams. You should print these off (from the document at the top) and try to do these questions under exam conditions. Then you can check your work with the video solution.
Ms Roberts teaches a Maths class with 17 students. 6 of them are working from school, and 11 of them are working remotely.
Each day, Ms Roberts chooses one student at random to make a presentation.
a. Find the probability that on a given day, Ms Roberts chooses someone who is working from home (1)
In September, Ms Roberts will teach 15 lessons with her class.
b. Find the probability that she chooses a student working remotely 8 times. (2)
c. Find the probability that she chooses a student working in school at least 9 times. (3)
(6 marks)
Video Solution
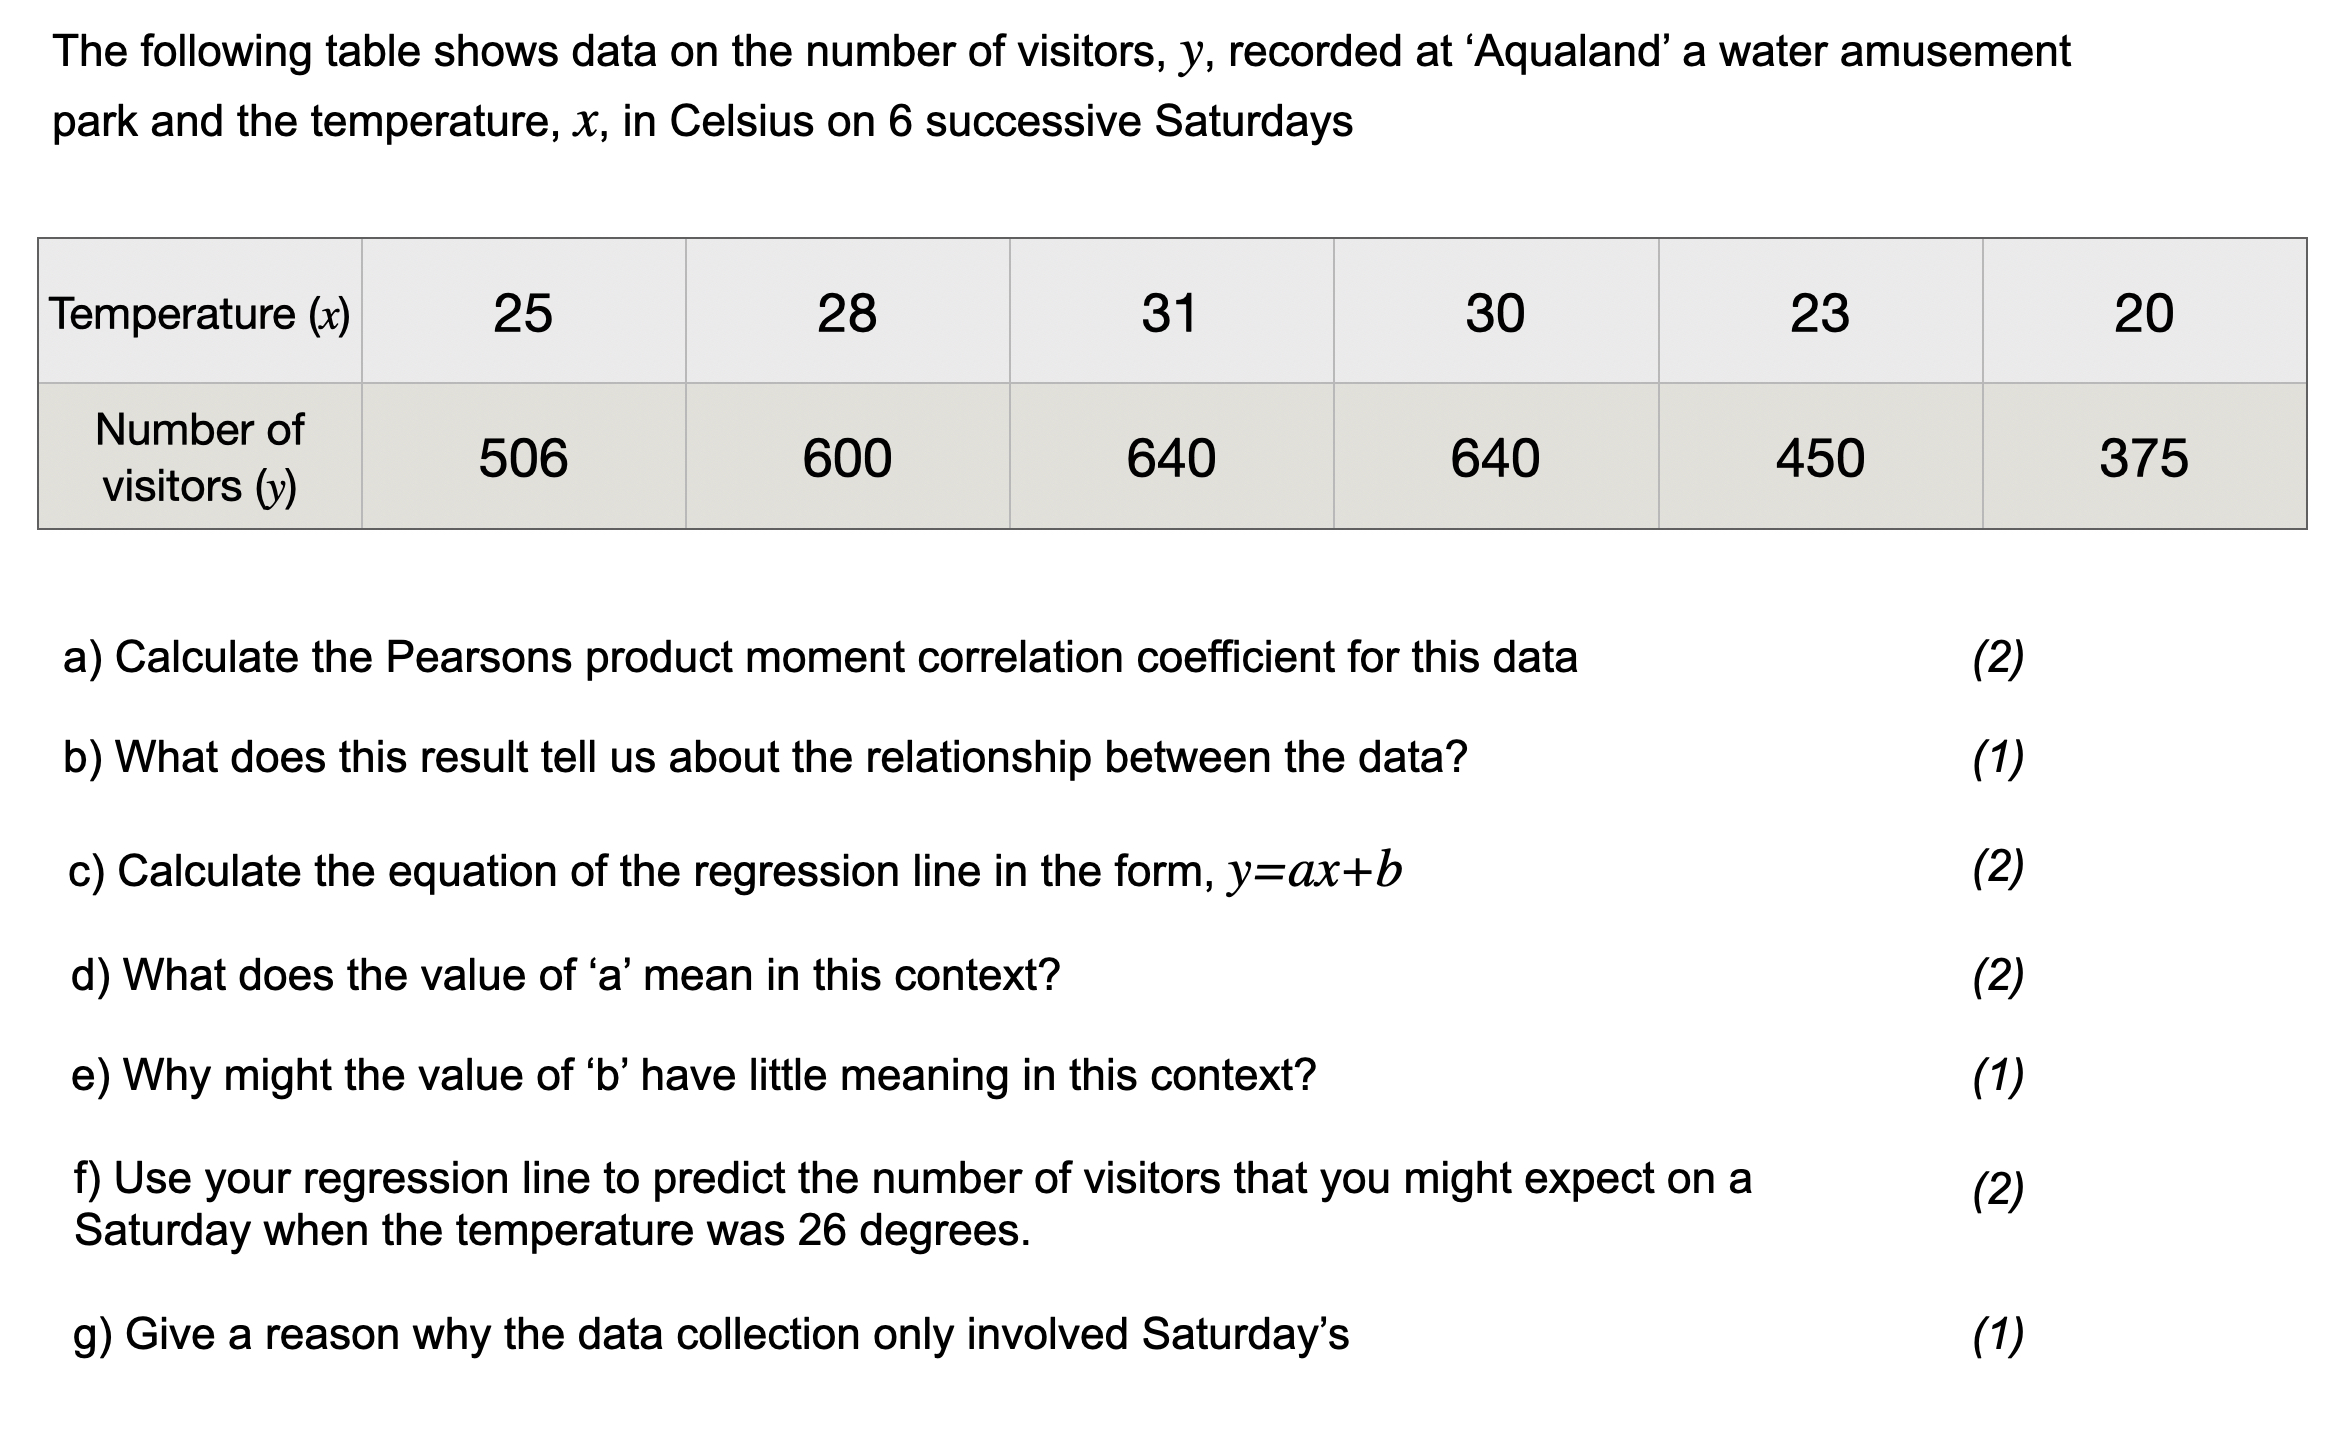
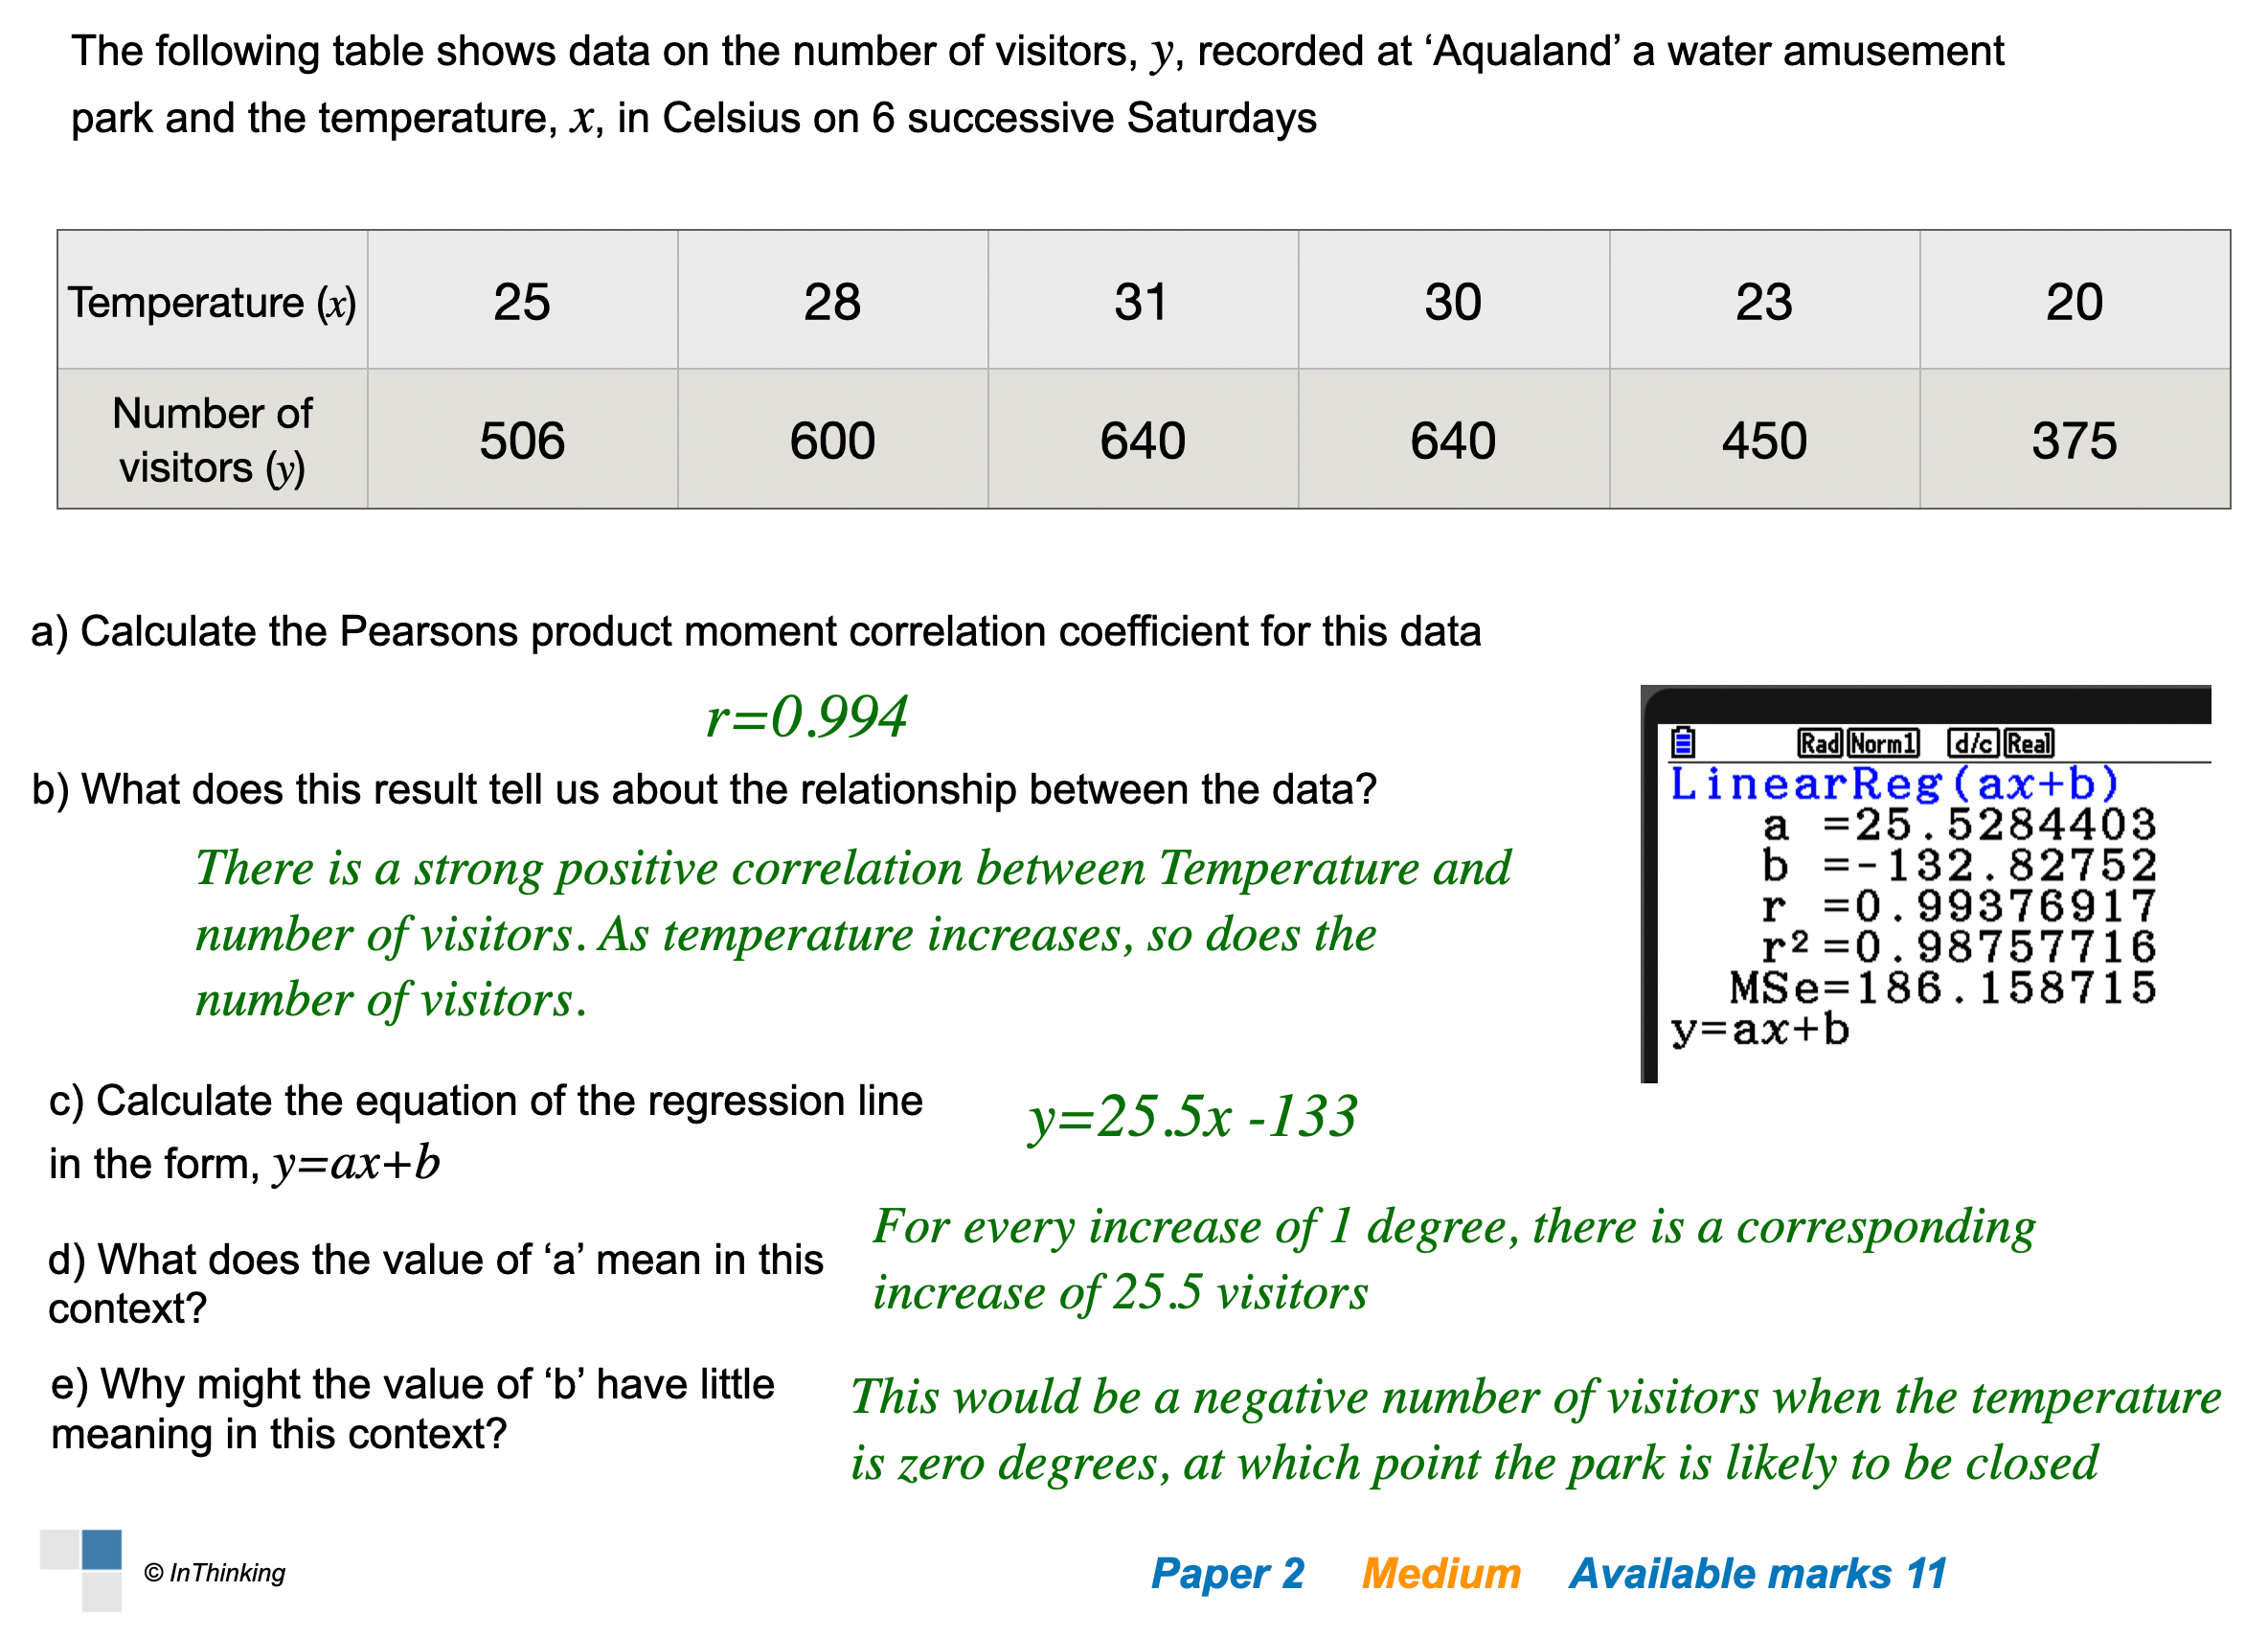
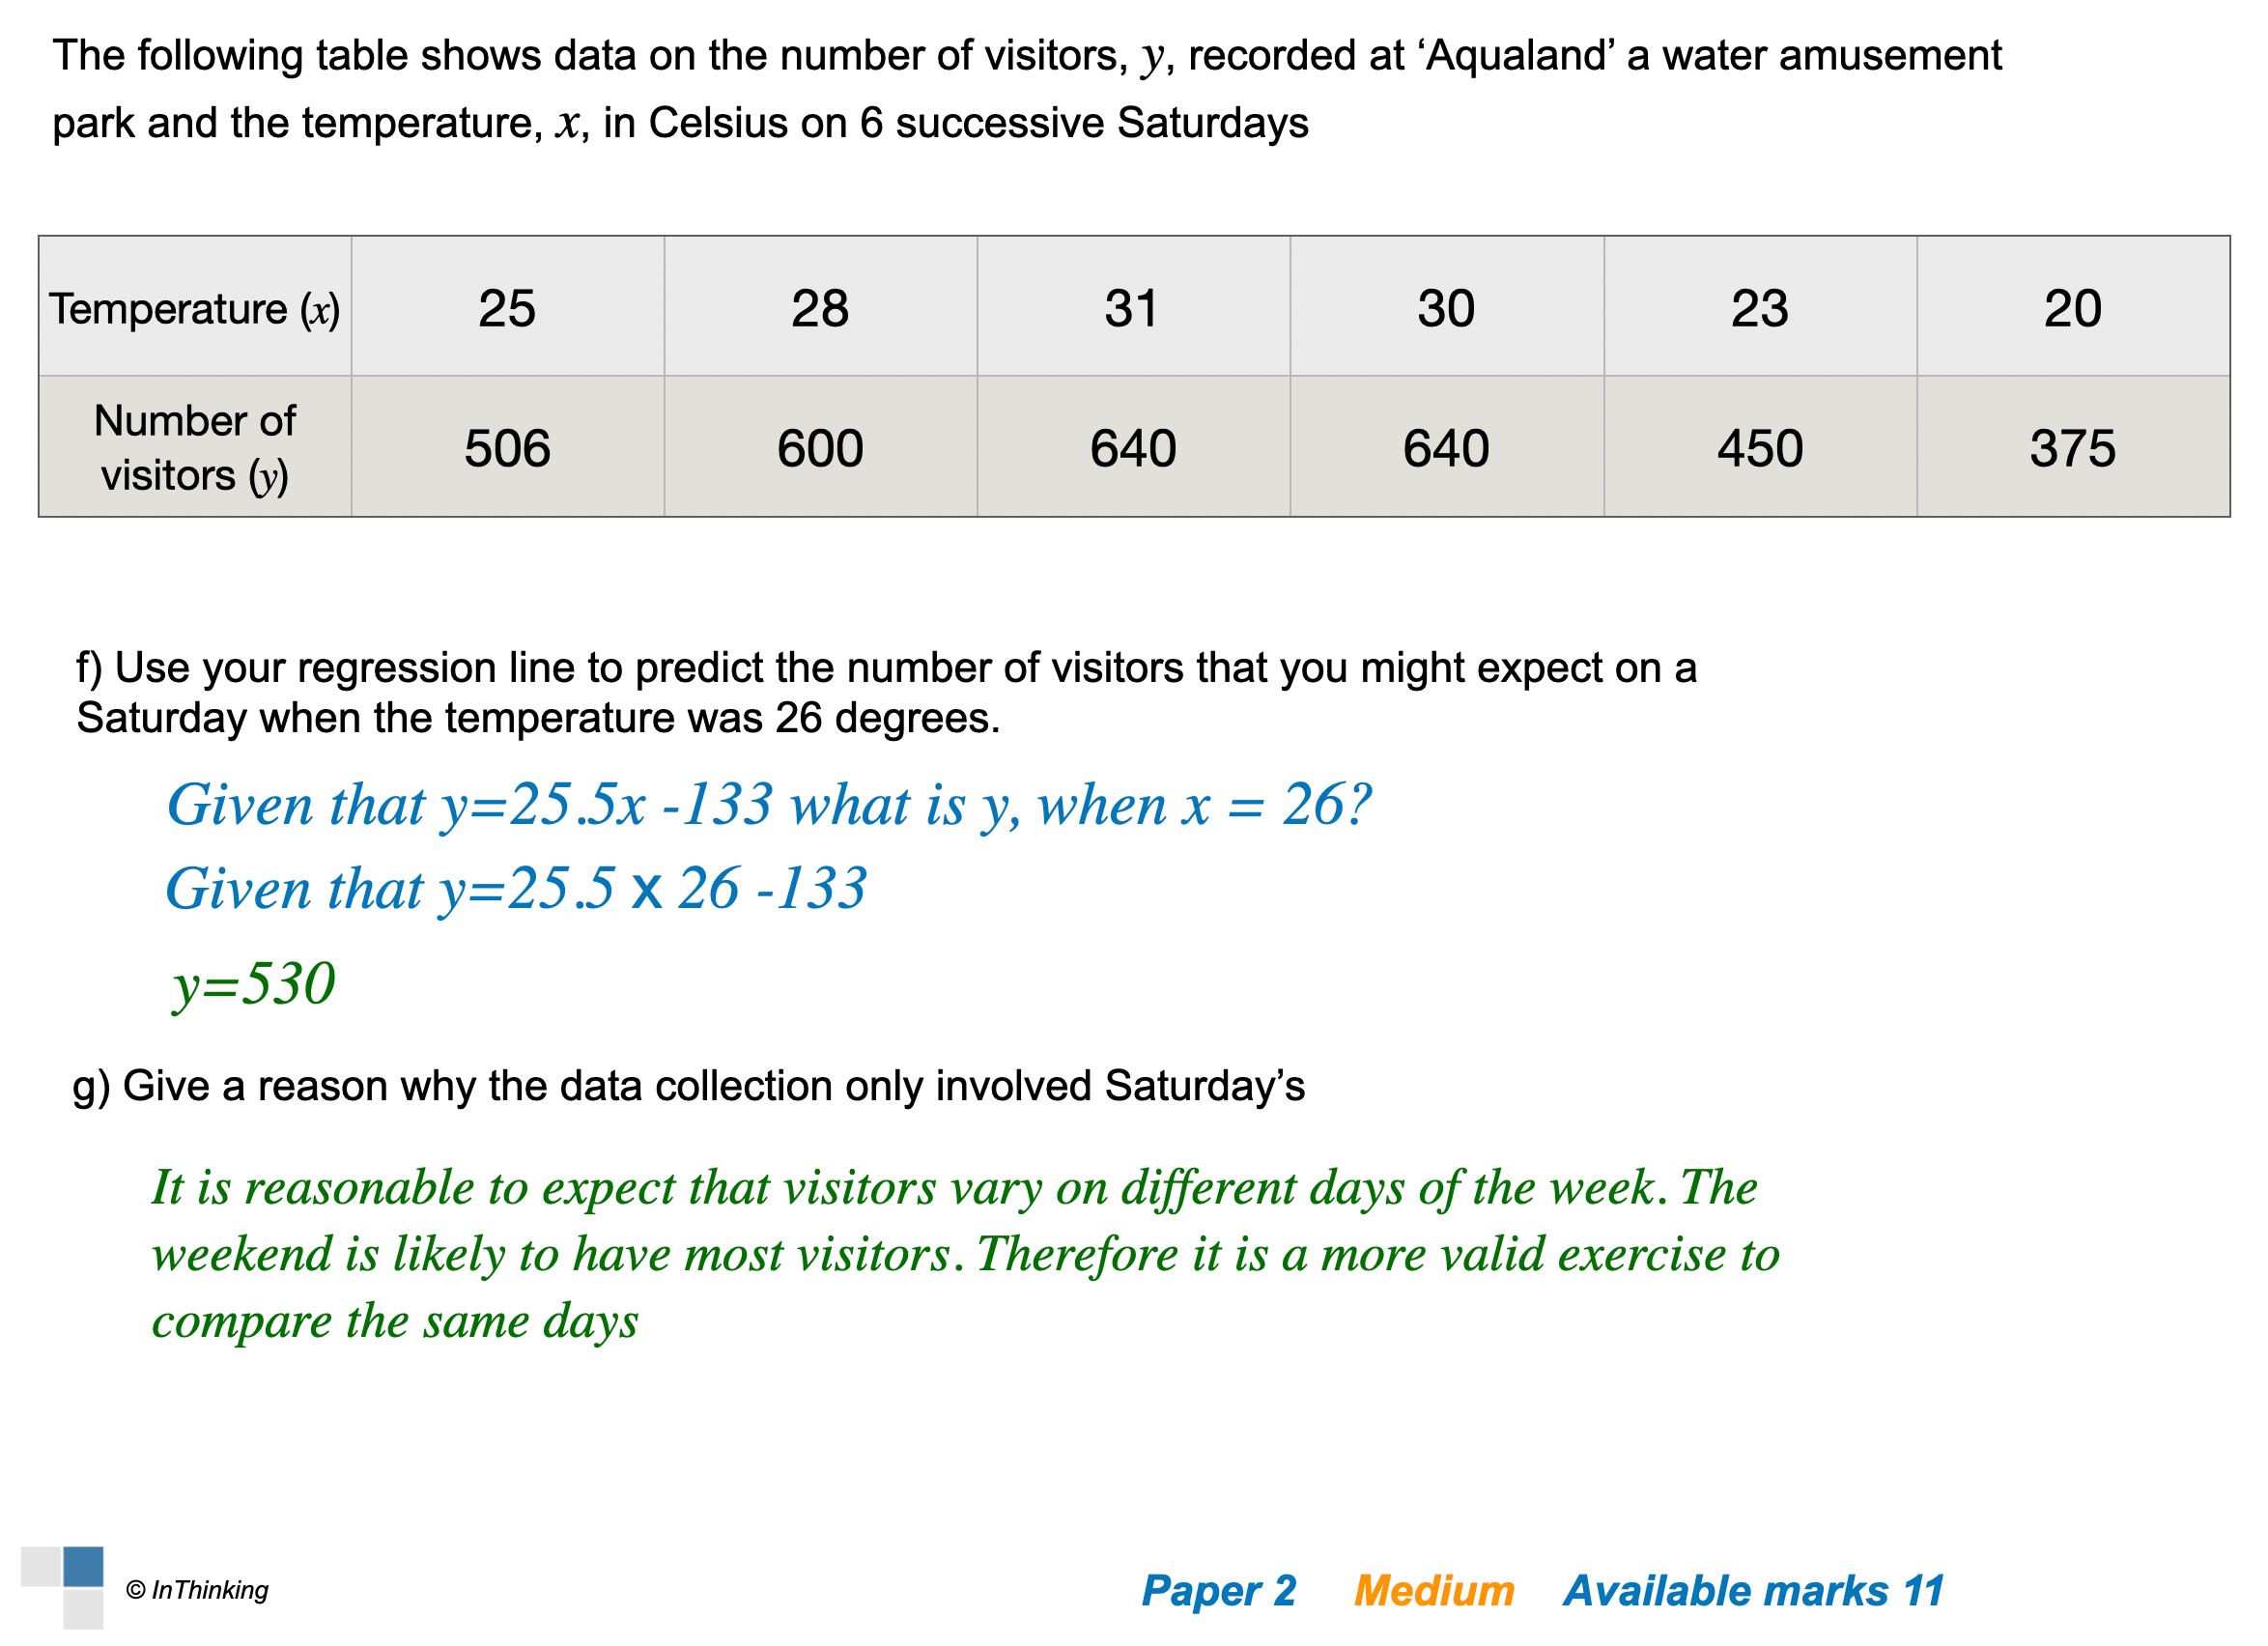
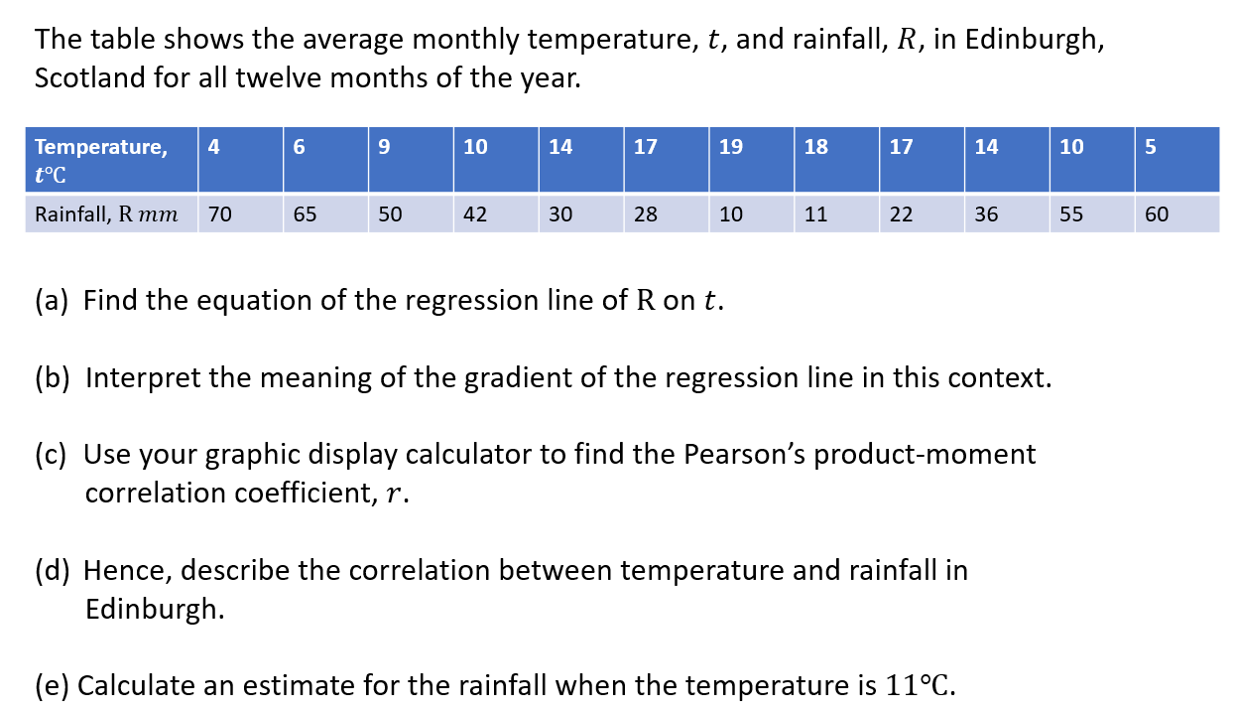
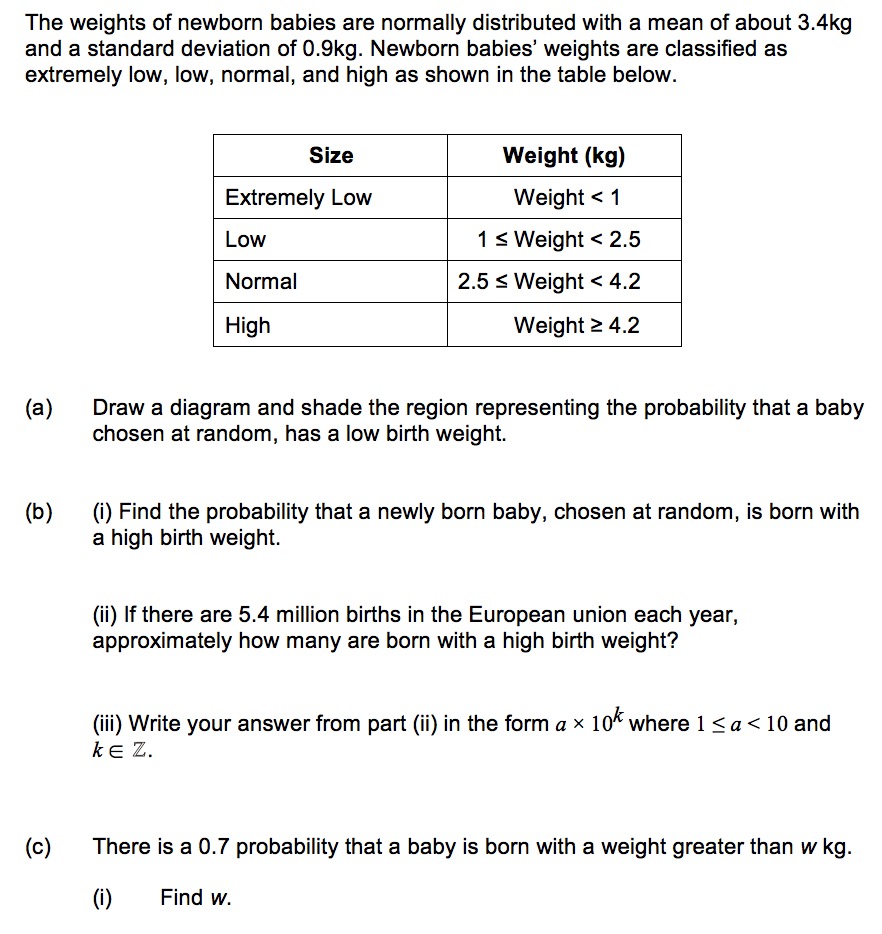
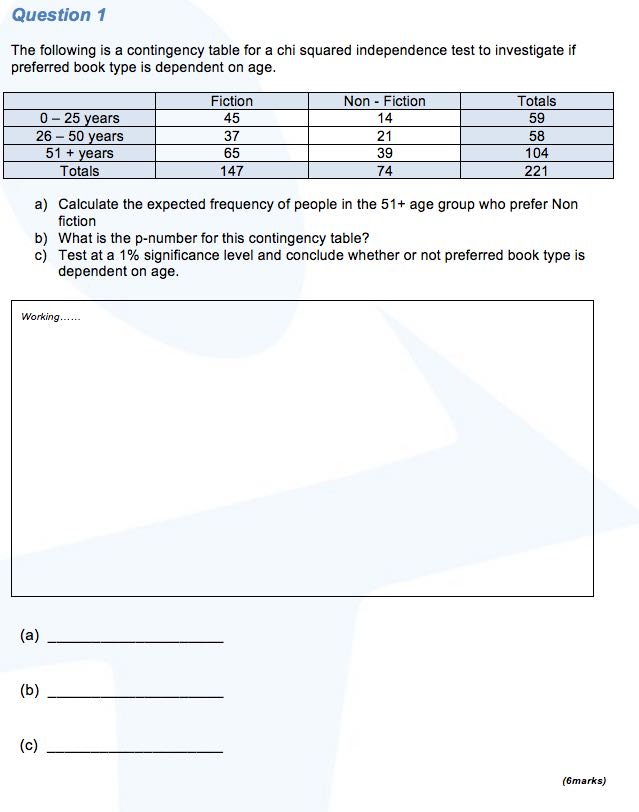
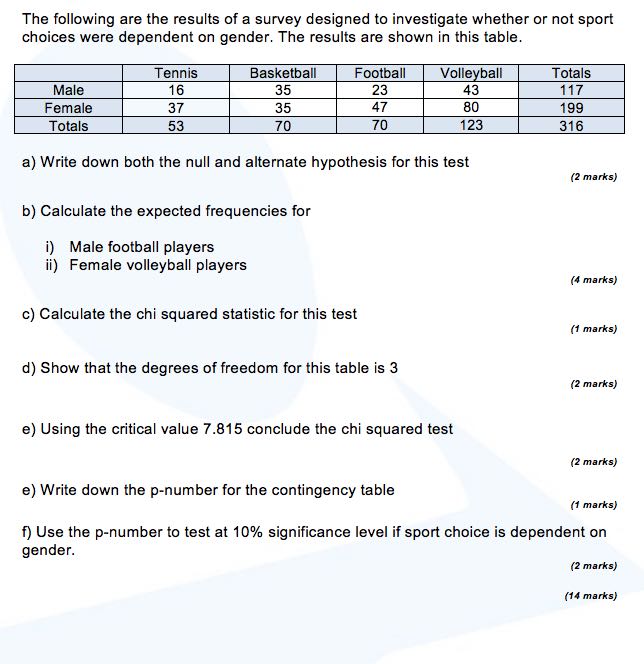
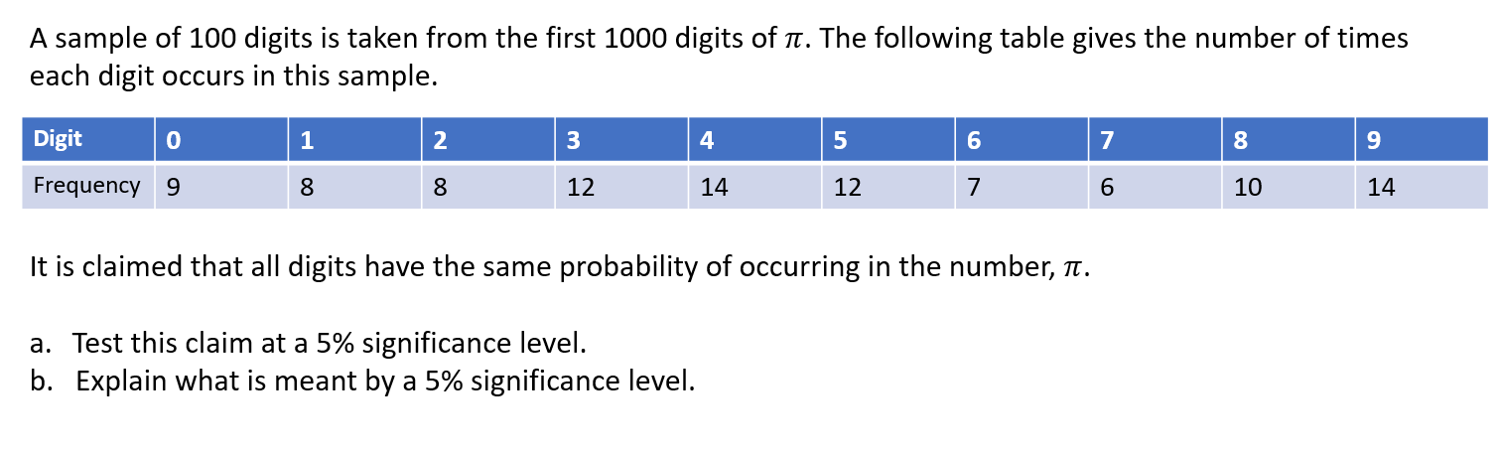
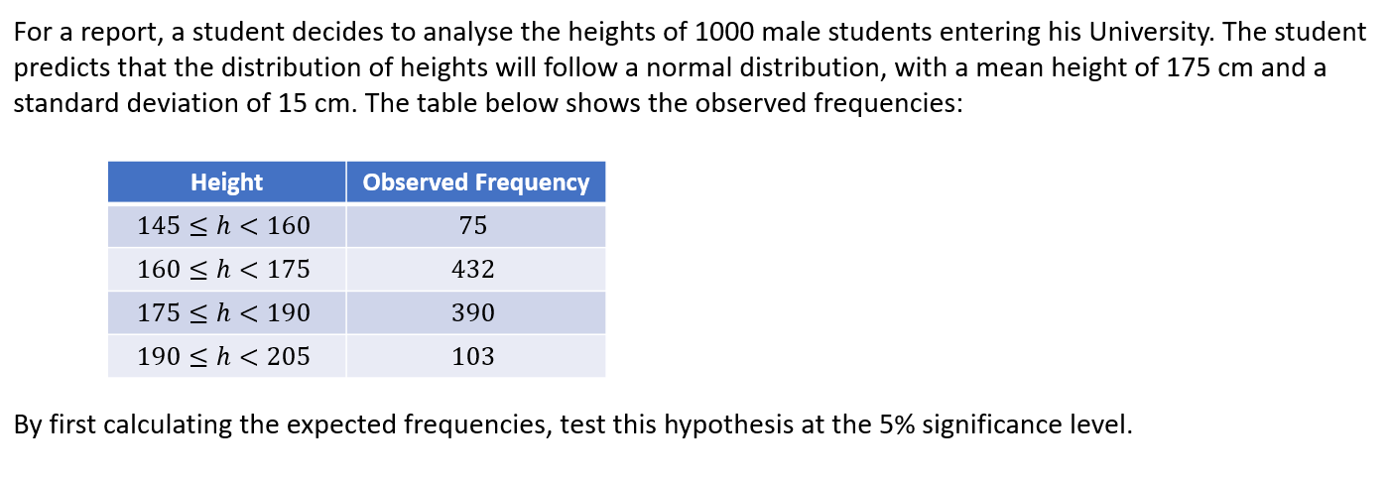
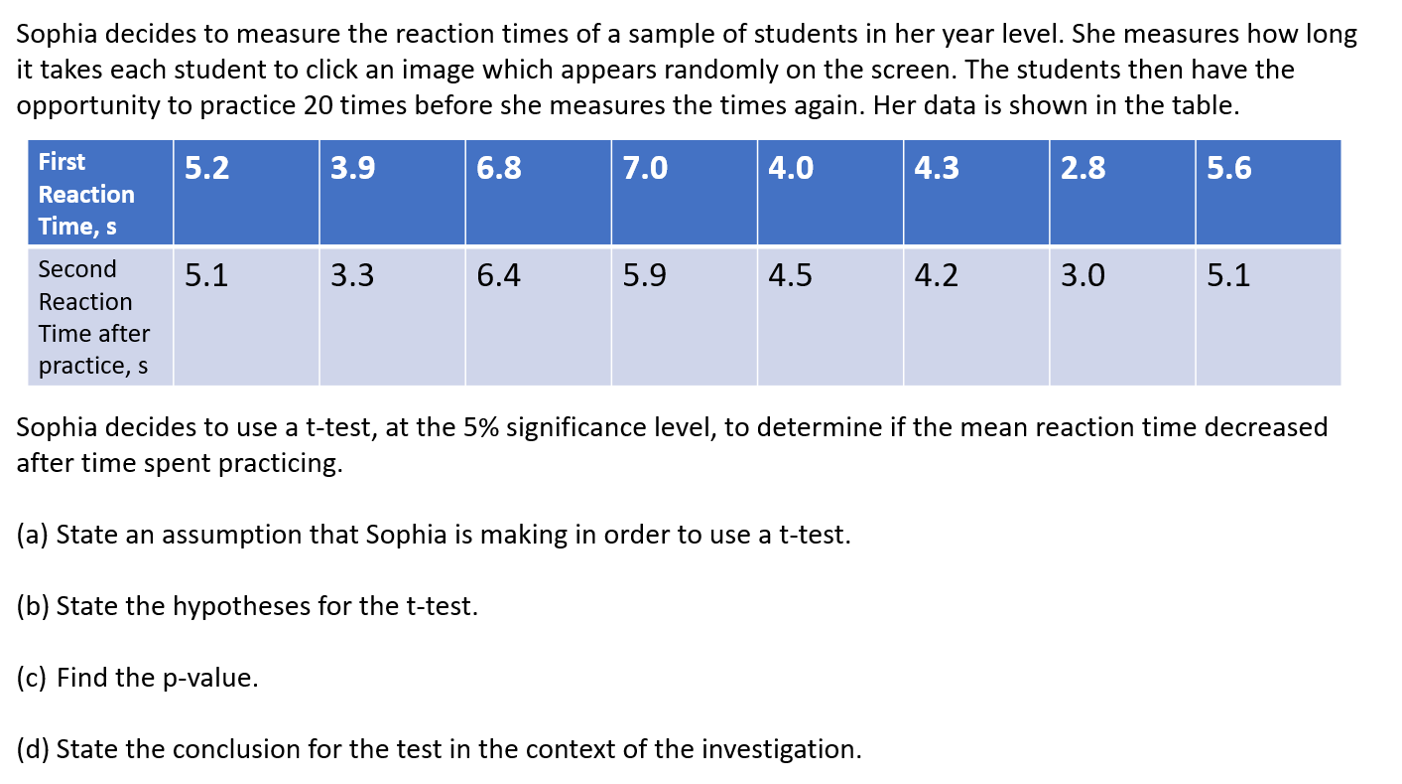
The following questions are based on IB exam style questions from past exams. You should print these off (from the document at the top) and try to do these questions under exam conditions. Then you can check your work with the video solution.
.png)
.png)
.png)
How much of Statistics & Probability Exam Questions have you understood?
 Twitter
  Facebook
  LinkedIn