| Date | May 2018 | Marks available | 3 | Reference code | 18M.2.SL.TZ1.S_4 |
| Level | Standard Level | Paper | Paper 2 | Time zone | Time zone 1 |
| Command term | Sketch | Question number | S_4 | Adapted from | N/A |
Question
Let g(x) = −(x − 1)2 + 5.
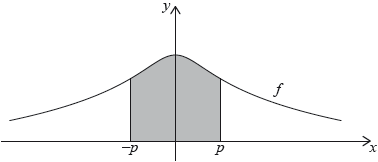
Let f(x) = x2. The following diagram shows part of the graph of f.

The graph of g intersects the graph of f at x = −1 and x = 2.
Write down the coordinates of the vertex of the graph of g.
On the grid above, sketch the graph of g for −2 ≤ x ≤ 4.
Find the area of the region enclosed by the graphs of f and g.
Markscheme
* This question is from an exam for a previous syllabus, and may contain minor differences in marking or structure.
(1,5) (exact) A1 N1
[1 mark]
 A1A1A1 N3
Note: The shape must be a concave-down parabola.
Only if the shape is correct, award the following for points in circles:
A1 for vertex,
A1 for correct intersection points,
A1 for correct endpoints.
[3 marks]
integrating and subtracting functions (in any order) (M1)
eg
correct substitution of limits or functions (accept missing dx, but do not accept any errors, including extra bits) (A1)
eg
area = 9 (exact) A1 N2
[3 marks]
Examiners report
Syllabus sections
-
22M.2.AHL.TZ1.6d.ii:
Find the area of the shaded region on the diagram.
-
18M.2.SL.TZ2.T_1a.i:
Write down the value of a.
-
17N.2.SL.TZ0.T_4c:
Copy and complete the tree diagram.
-
19M.2.SL.TZ2.T_1a:
Write down the null hypothesis, H0 , for this test.
-
22M.1.SL.TZ2.6b.ii:
Calculate the area of this region.
-
18M.2.SL.TZ1.S_4a:
Write down the coordinates of the vertex of the graph of g.
-
SPM.1.SL.TZ0.10c:
The three points A(0, 0) , B(3, 10) and C(, 0) define the vertices of a triangle.

Find the value of , the -coordinate of C, such that the area of the triangle is equal to the area of region R.
-
18M.1.SL.TZ1.S_5a:
Find .
-
17N.2.SL.TZ0.T_4f:
Find the probability that the tested adult is allergic to nuts given that the liquid turned blue.
-
18M.2.SL.TZ2.T_1a.ii:
Write down the value of b.
-
21M.1.SL.TZ1.13b:
Sieun observes that when the angle is , the ball will travel a horizontal distance of .
Find an expression for the function .
-
EXN.2.SL.TZ0.3b.ii:
Hence write down the domain of .
-
22M.1.SL.TZ2.6b.i:
Write down an integral for the area of the shaded region in diagram 2.
-
22M.1.SL.TZ2.6c:
Hence, determine the area enclosed between and .
-
22M.1.SL.TZ2.6a:
Calculate the area of the shaded region in diagram 1.
-
SPM.1.SL.TZ0.10a:
Write down an integral for the area of region R.
-
22M.1.SL.TZ1.12b:
One year after the company was founded, the profit was thousand dollars.
Find an expression for , when .
-
22M.1.SL.TZ1.6b:
Find the exact area of the shaded region in the painting.
-
22M.1.SL.TZ1.6c:
Find the area of the unshaded region in the painting.
-
22M.2.AHL.TZ1.2d:
The goat is tied in the field for hours.
Find the total volume of grass eaten by the goat during this time.
-
22M.2.AHL.TZ1.6d.i:
Find the area enclosed by , the -axis and the line .
-
21N.1.SL.TZ0.13a.iii:
Hence find the equation of the quadratic curve.
-
21N.1.SL.TZ0.13a.ii:
Hence form two equations in terms of and .
-
16N.2.SL.TZ0.T_6b:
Express this volume in .
-
17M.2.SL.TZ2.S_8b.i:
Write down the coordinates of A.
-
19M.2.SL.TZ2.T_1b:
State the number of degrees of freedom.
-
19M.2.SL.TZ2.T_1c.i:
the expected frequency of female students who chose to take the Chinese class.
-
19M.2.SL.TZ2.T_1d:
State whether or not H0 should be rejected. Justify your statement.
-
17M.2.SL.TZ2.S_8b.ii:
Write down the rate of change of at A.
-
17N.2.SL.TZ0.T_4d:
Find the probability that this adult is allergic to nuts and the liquid turns blue.
-
SPM.1.SL.TZ0.10b:
Find the area of region R.
-
19M.1.SL.TZ1.T_12c:
Write down the probability that the second spin is yellow, given that the first spin is blue.
-
17N.2.SL.TZ0.T_4g:
Estimate the number of employees, from this 38, who are allergic to nuts.
-
17M.2.SL.TZ2.S_8c.i:
Find the coordinates of B.
-
18M.3.AHL.TZ0.Hca_3c:
Hence write down a lower bound for .
-
19M.2.SL.TZ2.T_1e.iii:
Find the probability that at least one of the two students is female.
-
19M.1.SL.TZ1.T_12a:
Find the probability that both spins are yellow.
-
16N.2.SL.TZ0.S_6b:
The empty barrel is being filled with water. The volume of water in the barrel after minutes is given by . How long will it take for the barrel to be half-full?
-
18M.2.SL.TZ2.S_3b:
The region enclosed by the graph of , the y-axis and the x-axis is rotated 360° about the x-axis.
Find the volume of the solid formed.
-
19M.2.SL.TZ2.S_2b:
The region enclosed by the graph of , the -axis and the -axis is rotated 360º about the -axis. Find the volume of the solid formed.
-
19M.1.SL.TZ1.T_12b:
Find the probability that at least one of the spins is yellow.
-
19M.2.SL.TZ2.T_1e.i:
Find the probability that the student does not take the Spanish class.
-
17N.2.SL.TZ0.T_4a:
Find the probability that this person is not allergic to nuts.
-
18M.2.SL.TZ1.S_4c:
Find the area of the region enclosed by the graphs of f and g.
-
17N.2.SL.TZ0.S_5a:
Find the value of .
-
17N.2.SL.TZ0.T_4b:
Find the probability that both people chosen are not allergic to nuts.
-
19M.2.SL.TZ2.S_2a:
Find the -intercept of the graph of .
-
18M.2.SL.TZ2.T_1b.i:
Use the tree diagram to find the probability that an employee encountered traffic and was late for work.
-
18N.2.SL.TZ0.S_10c:
When = 0, the volume of water in the container is 2.3 m3. It is known that the container is never completely full of water during the 4 hour period.
Find the minimum volume of empty space in the container during the 4 hour period.
-
19M.2.SL.TZ2.T_1e.ii:
Find the probability that neither of the two students take the Spanish class.
-
18M.3.AHL.TZ0.Hca_3d:
Find an upper bound for .
-
17M.2.SL.TZ2.S_8d:
Let be the region enclosed by the graph of , the -axis, the line and the line . The region is rotated 360° about the -axis. Find the volume of the solid formed.
-
17M.2.SL.TZ2.S_8a:
Find the value of .
-
EXN.1.AHL.TZ0.10a.ii:
State in context what this value represents.
-
EXN.2.SL.TZ0.3c:
Find the range of .
-
18N.2.SL.TZ0.S_10a:
Find the volume of the container.
-
EXN.1.AHL.TZ0.10a.i:
Find .
-
18M.1.SL.TZ1.S_5b:
Part of the graph of f is shown in the following diagram.

The shaded region R is enclosed by the graph of f, the x-axis, and the lines x = 1 and x = 9 . Find the volume of the solid formed when R is revolved 360° about the x-axis.
-
17N.2.SL.TZ0.T_4e:
Find the probability that the liquid turns blue.
-
18M.3.AHL.TZ0.Hca_3a:
Find the value of .
-
18M.2.SL.TZ2.S_3a:
Find the x-intercept of the graph of .
-
18M.1.SL.TZ2.S_2a:
Find .
-
18N.2.SL.TZ0.S_10b.ii:
During the interval < < , he volume of water in the container increases by m3. Find the value of .
-
17N.2.SL.TZ0.S_5b:
The following diagram shows part of the graph of .
The region enclosed by the graph of , the -axis and the lines and is rotated 360° about the -axis. Find the volume of the solid formed.
-
21M.1.SL.TZ2.13a:
Find an expression for in terms of .
-
18M.3.AHL.TZ0.Hca_3b:
Illustrate graphically the inequality .
-
18M.1.SL.TZ2.T_7c:
Two girls are selected at random.
Calculate the probability that one girl answered questions in Mandarin and the other answered questions in Hindi.
-
21M.1.SL.TZ1.13a:
Determine whether the graph of against is increasing or decreasing at .
-
21M.2.SL.TZ1.5a.i:
Find .
-
18M.1.SL.TZ2.S_2b:
Find the area of the region enclosed by the graph of , the x-axis and the lines x = 1 and x = 2 .
-
16N.2.SL.TZ0.S_6a:
Use the model to find the volume of the barrel.
-
21M.2.AHL.TZ1.2d.ii:
Hence find the cross-sectional area of the tunnel.
-
18N.2.SL.TZ0.S_10b.i:
Find the value of and of .
-
21M.1.SL.TZ2.13b:
The company regularly increases the number of cars it produces.
Describe how their profit changes if they increase production to over cars per month and up to cars per month. Justify your answer.
-
17M.2.SL.TZ2.S_8c.ii:
Find the the rate of change of at B.
-
21M.2.SL.TZ1.5c.i:
Write down the integral which can be used to find the cross-sectional area of the tunnel.
-
21M.2.SL.TZ1.5c.ii:
Hence find the cross-sectional area of the tunnel.
-
21M.2.AHL.TZ1.2d.i:
Write down the integral which can be used to find the cross-sectional area of the tunnel.
-
21N.1.SL.TZ0.13b:
Find the area of the shaded region in Irina’s design.
-
EXN.2.SL.TZ0.3b.i:
Find the value of at which the ball hits the ground.
-
EXN.1.AHL.TZ0.10c:
Determine and state what it represents.
-
EXN.1.AHL.TZ0.10b:
Find an expression for in terms of .
-
EXN.2.SL.TZ0.3a:
Find an expression for the height of the ball at time .
-
EXN.2.SL.TZ0.6g:
Use the expression found in (f) to calculate a value for .
-
21N.1.SL.TZ0.13a.i:
Write down the value of .