
 This page deals with one-variable statistics. You need to know how to represent the data in tables and diagrams (histograms, cumulative frequency graphs and box and whisker diagrams), as well measure the data using measures of central tendency (mean, median and mode) and dispersion (interquartile range, standard deviation and variance). It is not a difficult topic, but attention to detail is required. It is recommended that you work through the revision notes carefully.
On this page, you should learn about
- frequency distributions
- histograms
- cumulative frequency graphs
- mean, median,mode
- quartiles, percentiles
- range, interquartile range, standard deviation and variance
- box and whisker diagrams
- outliers
- the effect of constant changes to mean and standard deviation
Print from here
Here is a quiz about some definitions in statistics
START QUIZ!
Here is a quiz about boxplots, cumulative frequency and histograms
START QUIZ!
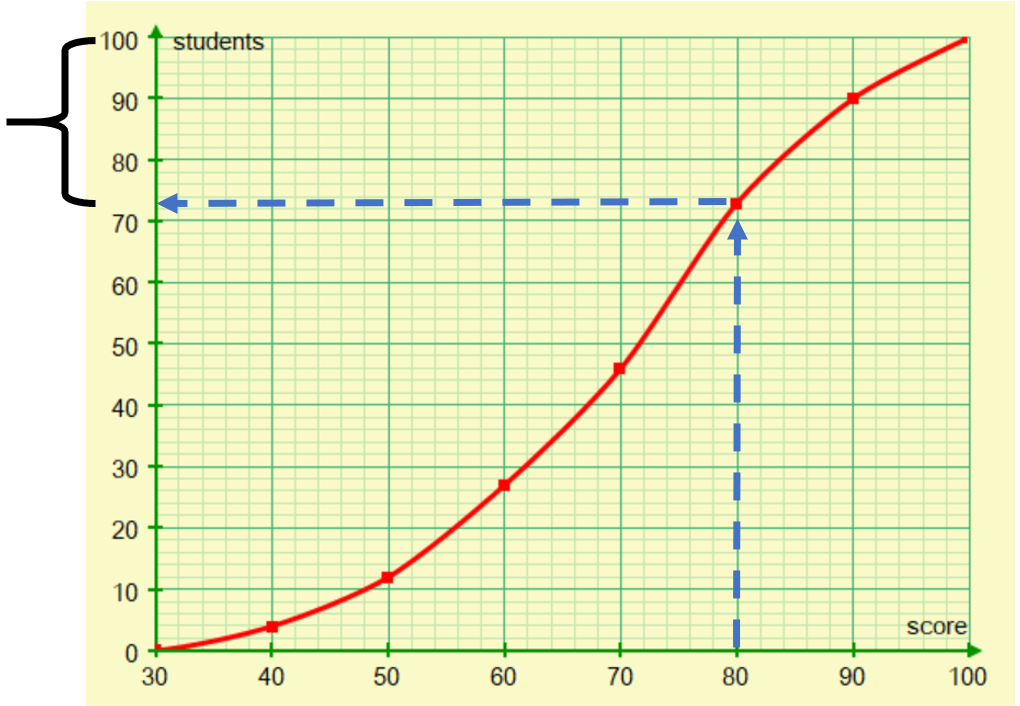
Here is a cumulative frequency graph showing the scores of students in a test.
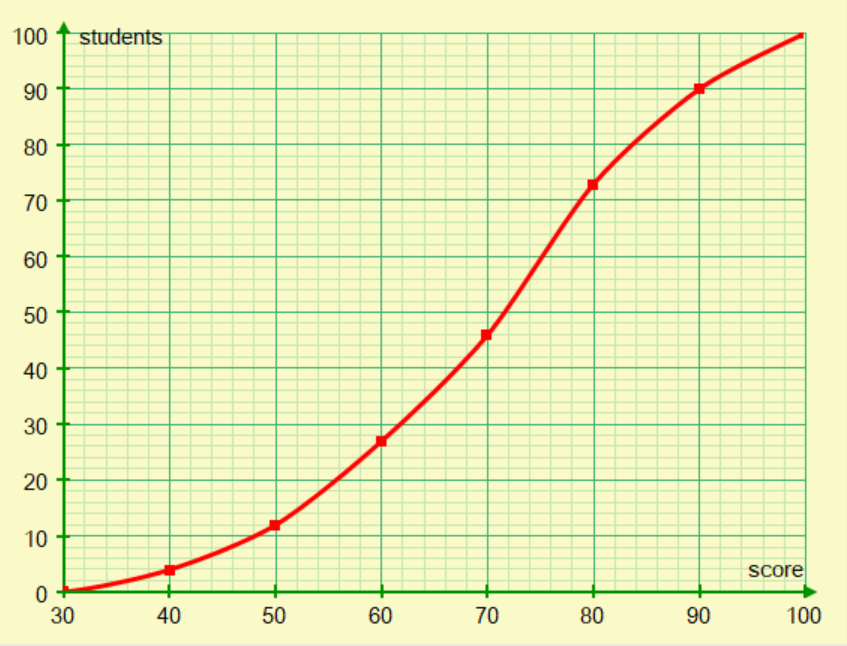
How many students scored more than 80?
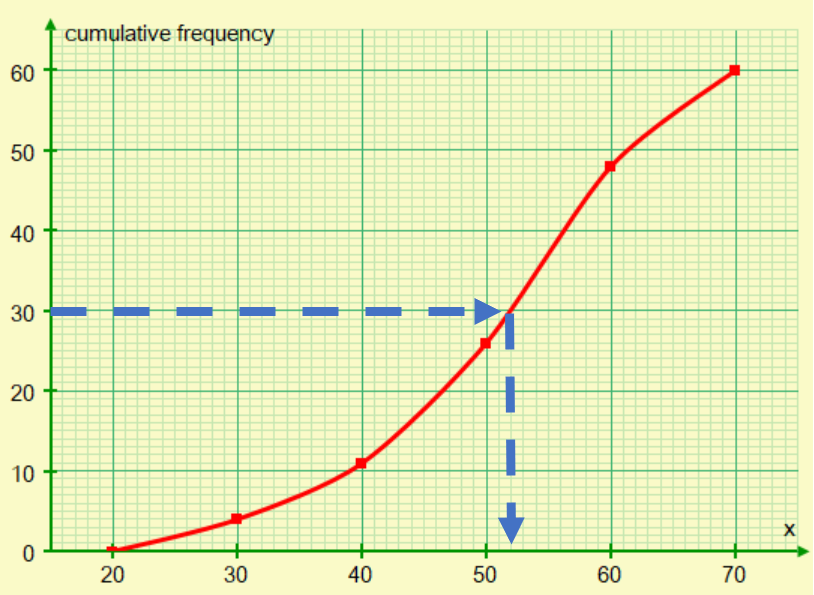
Here is a cumulative frequency graph
Find the median
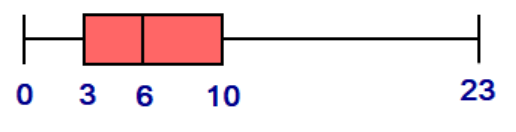
The following data set is displayed in a box-and-whisker plot
1, 3, 4, 4, 6, 6, 6, 7, 7, 8, 10, 15
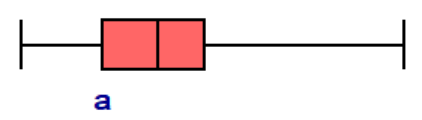
Find the value of a
a =
a is the lower quartile
There are different methods for finding the lower quartile, but with 12 items it will lie in between the 3rd and the 4th items. So the lower quartile is 4.
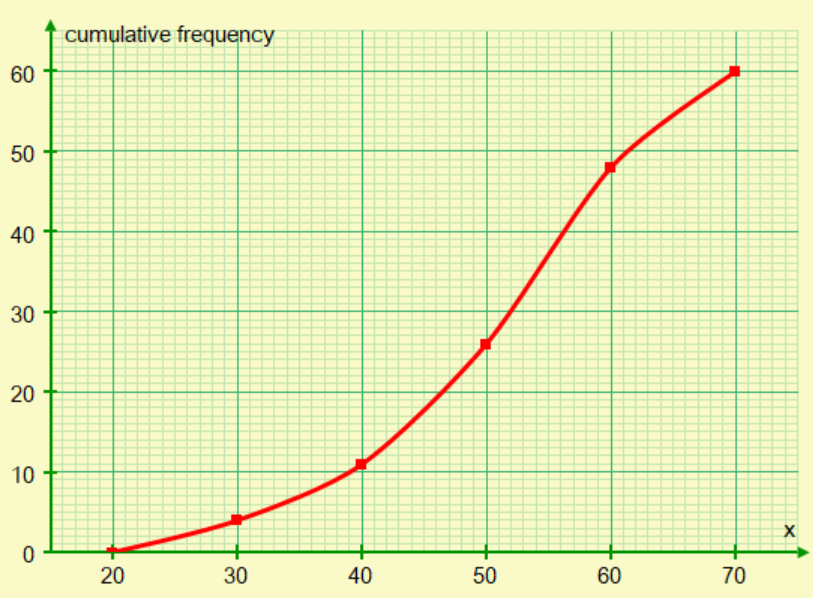
Here is a cumulative frequency graph
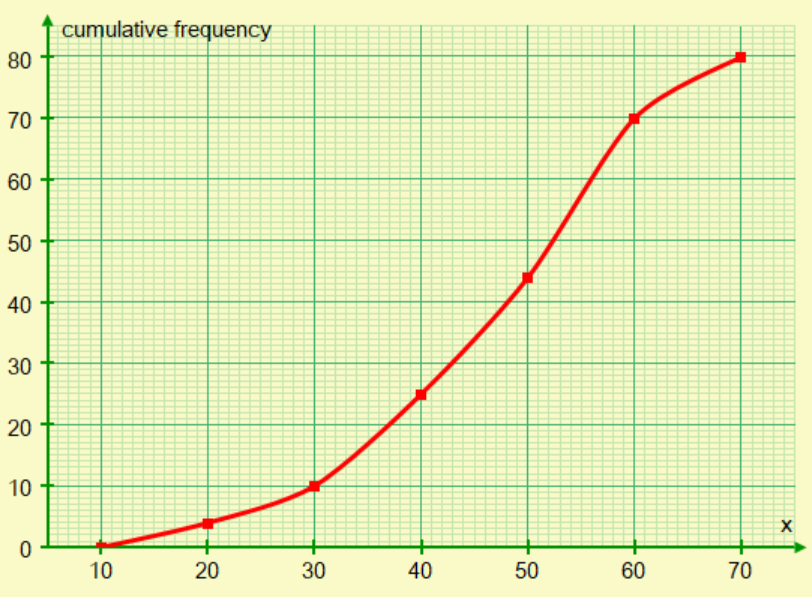
Find the interquartile range
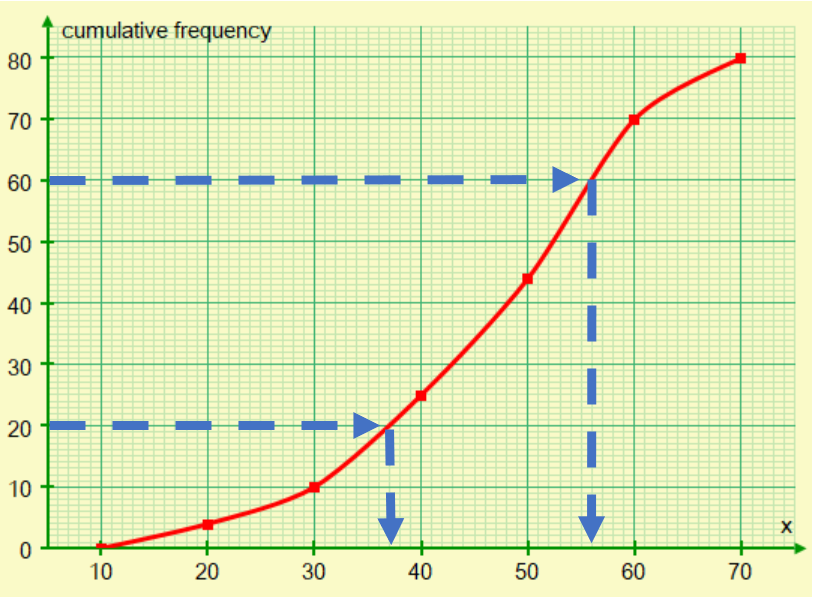
Q1 = 37
Q3 = 56
IQR = 56 - 37 = 19
The following graph shows the scores of students in a test. The scores for grade 7 are missing from the graph. If the mean score for the whole class is 5.1, find the number of students who scored grade 7.
Number of students scoring grade 7 =
mean = \(\frac {3+20+35+30+7x}{18+x}=5.1\)
88 + 7x = 7.1(18 + x)
88 + 7x = 91.8 + 5.1x
1.9x = 3.8
x = 2
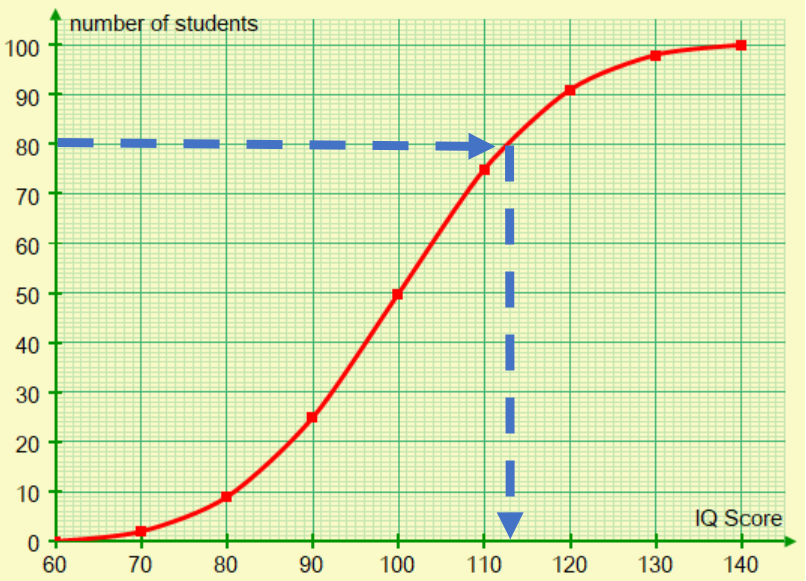
The graph below shows the IQs of grade 12 students
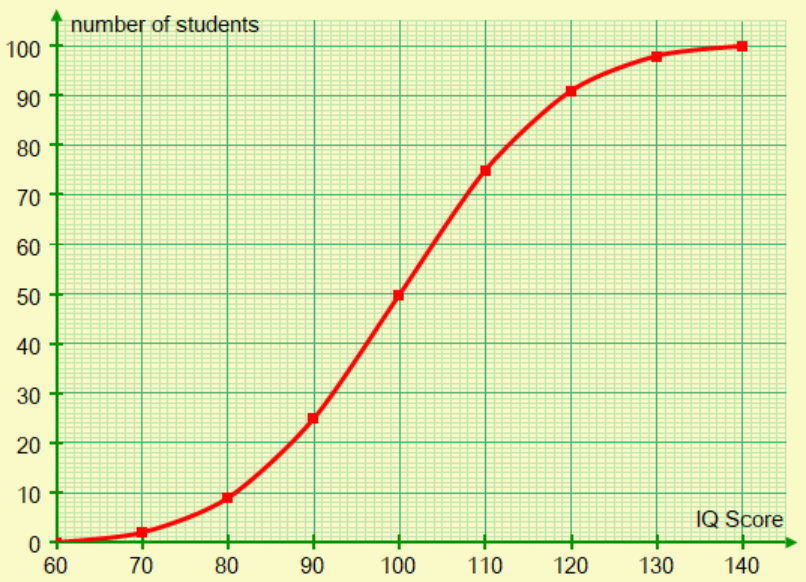
What score would a student in the 80th percentile score?
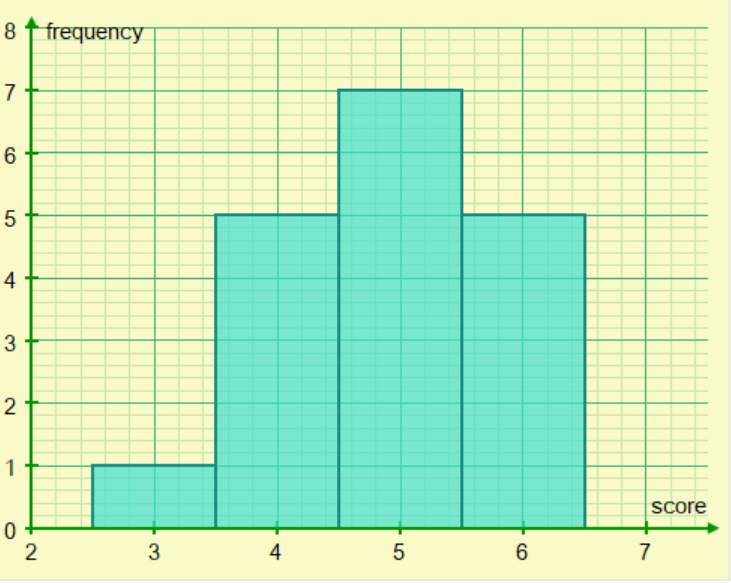
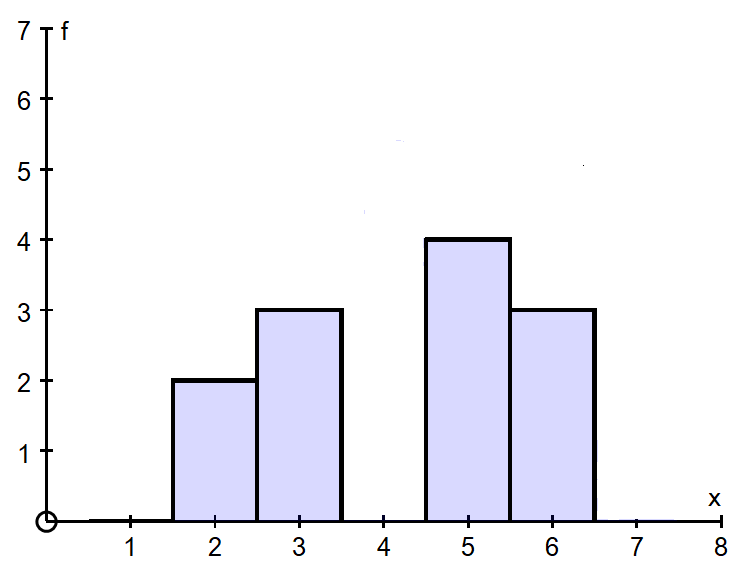
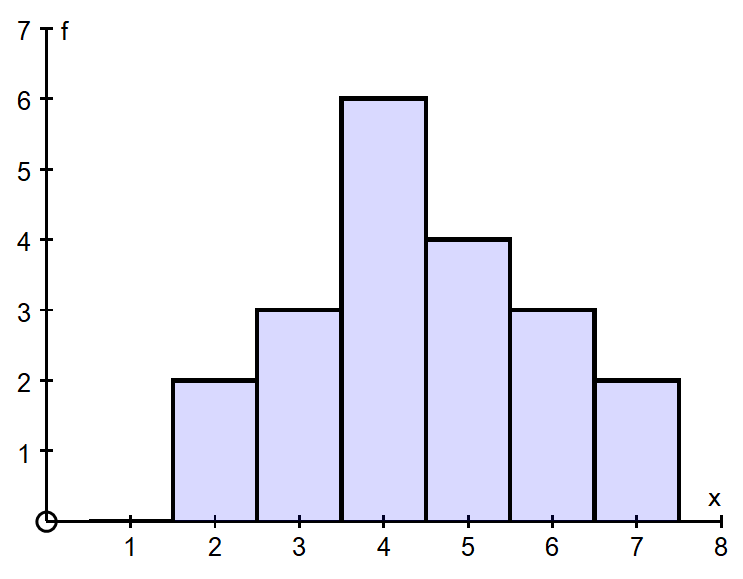
Q7 The following histogram represents scores in a test
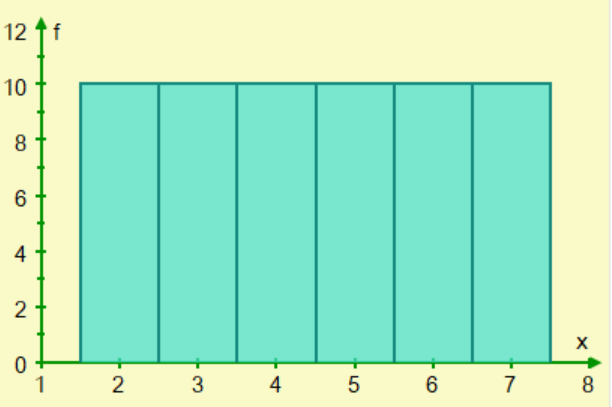
Which box-and-whisker plot best represents these data
A 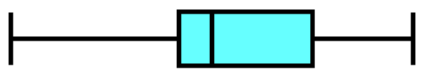
B 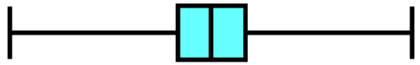
C 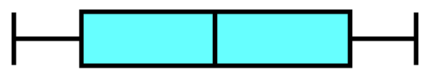
D 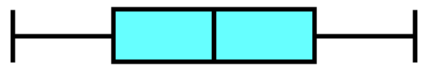
The data are uniform and so evenly spread
The following cumulative frequency graph shows the monthly income of 60 families
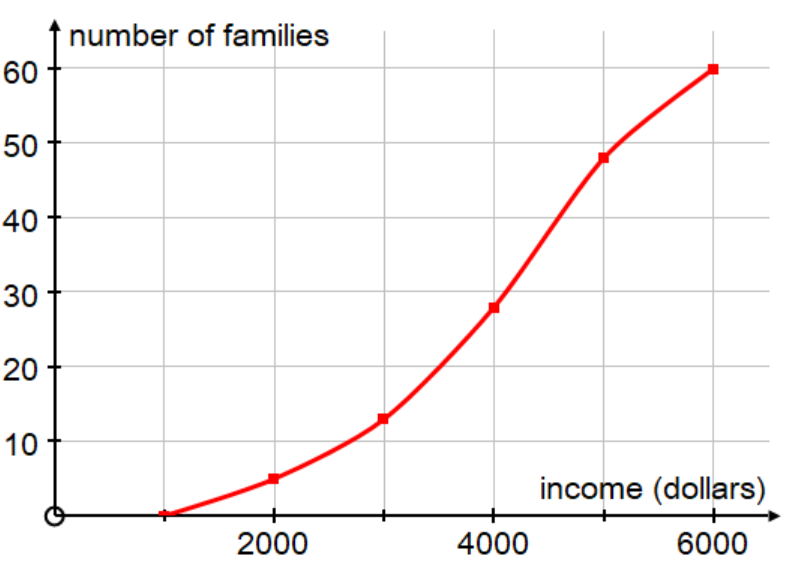
Which box-and-whisker plot best represents these data
A 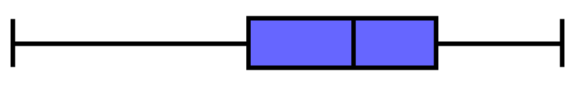
B 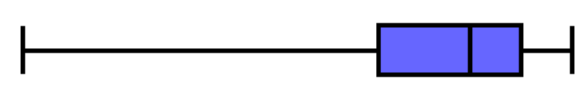
C 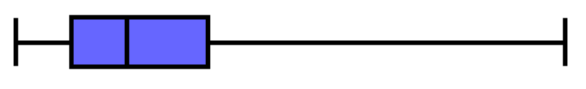
D 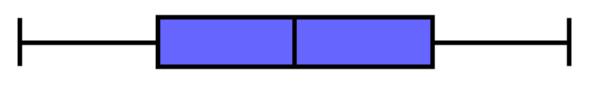
From the cumulative frequency graph we can deduce that
Minimum = $10 000
Maximum = $60 000
Median is a little over $40 000 which is just over halfway in between these two values.
Hence A is the best fit.
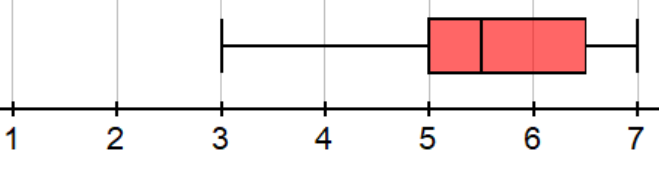
The box-and-whisker plot below shows the number of times students visit YouTube on a particular day
One student visits the site k times (k > 10). What is the least value of k if k is an outlier?
k =
Outlier is defined as a data item which is more than 1.5 × interquartile range (IQR) from the nearest quartile.
IQR = 7
Upper boundary = 10 + 1.5 × 7 = 20.5
Upper boundary = 21
The box-and-whisker plot below shows the grades in a test of 50 students
How many students scored 5 or less?
This question is more challenging than it looks!
The median score is 5.5 which means that
- the 25th person score 5
- the 26th person score is 6
Here is a quiz about mean and standard deviation
START QUIZ!
The number of goals scored per match in a season is given below
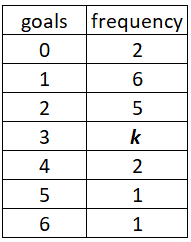
Given that the mean number of goals per match is 2.2 , find the value of k.
k =
Mean = \(\frac {0+6+10+3k+8+5+6}{2+6+k+2+1+1}=2.2\)
35+3k = 2.2(17 + k)
35 + 3k = 37.4 + 2.2k
0.8k = 2.4
k = 3
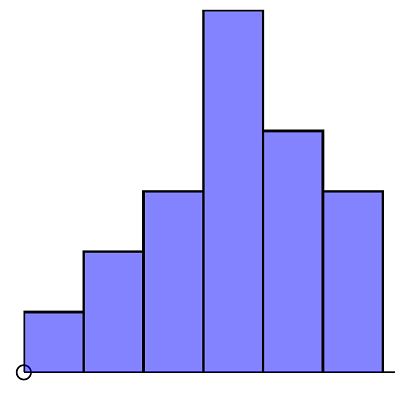
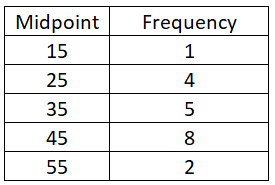
 The histogram below shows the scores in an examination.
Calculate the mean score.
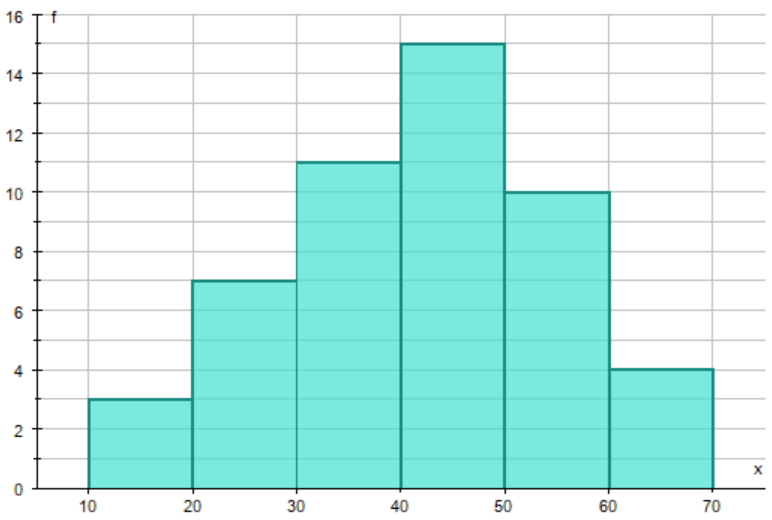
Mean =
The data from the histogram can be converted into a frequency table
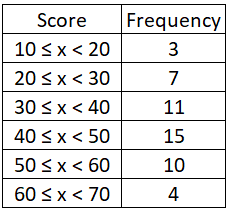
The midpoint of the scores needs to be used
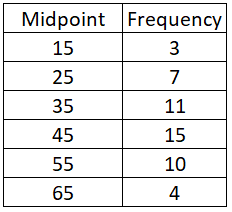
Enter these data into your graphical calculator. Don't forget to set the frequency as the second list.
The cumulative frequency graph shows the score in a test.
Calculate the standard deviation of the scores to 3 significant figures.
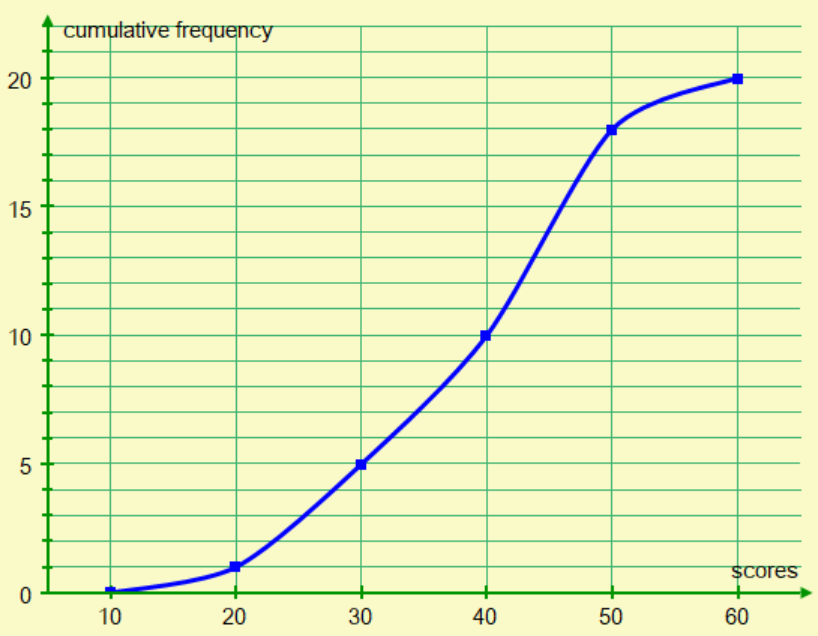
Standard deviation =
The data can be converted into a table
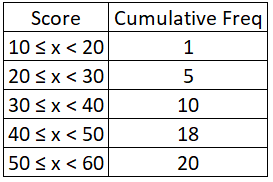
We need a frequency table with midpoint scores
Enter these data into your graphical calculator. Don't forget to set the frequency as the second list.
The mean of five numbers is 10.8. One of the numbers is 12 and another is 18.
The other three numbers are the same. Find the valule of one of the three numbers.
number =
Total of 5 numbers = 10.8 x 5 = 54
Let x be one of the three unknown numbers
12 + 18 + 3x = 54
3x = 24
x = 8
A student takes the bus to school. She records the time taken on 20 days.
She finds the
\(\sum_{i=1}^{20} x _i=580\) and \(\sum_{i=1}^{20} x _i^2=16 948\)
Find the standard deviation of the times taken to 3 significant figures
standard deviation =
standard deviation = \(\sqrt {\frac{\sum_{i=1}^{20} x _i^2}{n}-\frac{\sum_{i=1}^{20} x _i}{n}}\)
= \(\sqrt {\frac{16948}{20}-\frac{580}{20}}\)
\(\approx 2.52982\)
The mean score of 3 students in a test is 69.
A 4th student takes the test. The mean of the 4 students is 71.
What is the score of the 4th student?
Sum of 3 students = 3x69 = 207
Sum of 4 students = 4x71 = 284
4th student scores 284 - 207 = 77
10 students in a class take a test.
One student gets grade 1, four get grade 6 and all the other students get grade 7.
How many students score above the mean grade of the class?
Answer =
Mean = \(\frac{1+6\times 4+5\times 7}{10}=6\)
In a test, the mean score = 55 and the standard deviation = 5
The teacher increases the scores by 3 marks.
Which of the following is true for the new scores?
In general, if each number in a data set is increased by b
The mean is increased by b
The standard deviation remains unchanged (and the variance remains unchanged)
Variance = (standard deviation)²
In a test, the mean score = 55 and the standard deviation = 5
The teacher doubles each of the scores
Which of the following is true for the new scores?
In general, if each number in a data set is multiplied by a
The mean is multipled by a
The standard deviation is multiplied by |a|
The variance is multiplies by a²
Consider the data set {k - 3 , k - 1 , k + 2 , k + 4}
Each number in the above data is now decreased by 4 and the new mean is 6.5.
Find the value of k.
k =
old mean = 6.5
New mean = 10.5
\(\frac{k - 3+k-1+k+2+k+4}{4}=10.5\)
\(\frac{4k+2}{4}=10.5\)
k = 10


During week 1, a group of 60 athletes were asked to record the amount of water, X litres, that they consumed in that week. Here are the results
\(\sum x=1470\)
\(\sum x^2=36\ 132.6\)
Calculate
a. the mean of X
b. the standard deviation of X
During week 2, as part of a programme to improve their performance, the athletes were instructed to drink 10% more water. Assuming that they do this, find for week 2
c. the new mean
d. the new standard deviation
Hint
Full Solution
The graph below shows the scores in the SL Mathematics Analysis and Approaches for at Goodenough High School. There are 20 students, the minimum score was 2 and the mean score is 4.45
How many grade 4s and how many grade 7s were there?
Hint
Full Solution


The cumulative frequency graph gives information about the lengths, in minutes, of 80 telephone calls.
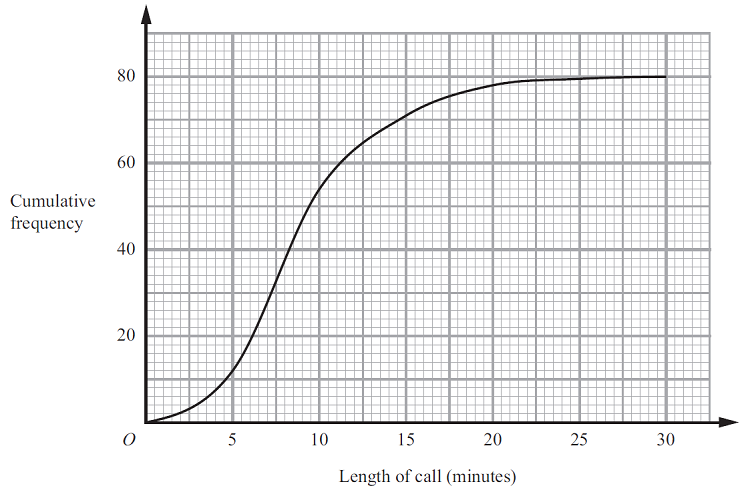
a. Find the median length of a phone call
b. Find the interquartile range of the length of a phone call
c. Find the number of phone calls that were more than 10 minutes in length
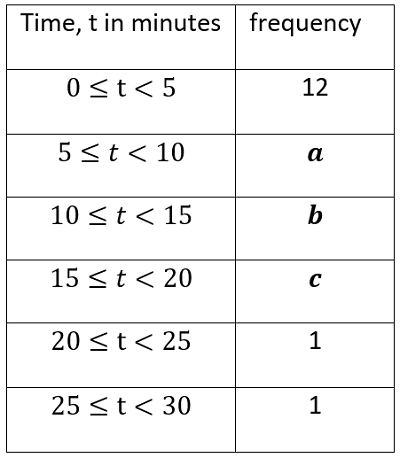
d. The frequency table below shows the lengths of the 80 phone calls. Find values a, b and c.
e. These data contain some outliers. How many outliers are there?
f. Calculate an estimate of the mean length of a phone call
Hint
Full Solution
How much of Representing and Measuring Data have you understood?
 Twitter
  Facebook
  LinkedIn