| Date | November Example question | Marks available | 2 | Reference code | EXN.3.AHL.TZ0.1 |
| Level | Additional Higher Level | Paper | Paper 3 | Time zone | Time zone 0 |
| Command term | Show that | Question number | 1 | Adapted from | N/A |
Question
An estate manager is responsible for stocking a small lake with fish. He begins by introducing fish into the lake and monitors their population growth to determine the likely carrying capacity of the lake.
After one year an accurate assessment of the number of fish in the lake is taken and it is found to be .
Let be the number of fish years after the fish have been introduced to the lake.
Initially it is assumed that the rate of increase of will be constant.
When the estate manager again decides to estimate the number of fish in the lake. To do this he first catches fish and marks them, so they can be recognized if caught again. These fish are then released back into the lake. A few days later he catches another fish, releasing each fish after it has been checked, and finds of them are marked.
Let be the number of marked fish caught in the second sample, where is considered to be distributed as . Assume the number of fish in the lake is .
The estate manager decides that he needs bounds for the total number of fish in the lake.
The estate manager feels confident that the proportion of marked fish in the lake will be within standard deviations of the proportion of marked fish in the sample and decides these will form the upper and lower bounds of his estimate.
The estate manager now believes the population of fish will follow the logistic model where is the carrying capacity and .
The estate manager would like to know if the population of fish in the lake will eventually reach .
Use this model to predict the number of fish in the lake when .
Assuming the proportion of marked fish in the second sample is equal to the proportion of marked fish in the lake, show that the estate manager will estimate there are now fish in the lake.
Write down the value of and the value of .
State an assumption that is being made for to be considered as following a binomial distribution.
Show that an estimate for is .
Hence show that the variance of the proportion of marked fish in the sample, , is .
Taking the value for the variance given in (d) (ii) as a good approximation for the true variance, find the upper and lower bounds for the proportion of marked fish in the lake.
Hence find upper and lower bounds for the number of fish in the lake when .
Given this result, comment on the validity of the linear model used in part (a).
Assuming a carrying capacity of use the given values of and to calculate the parameters and .
Use these parameters to calculate the value of predicted by this model.
Comment on the likelihood of the fish population reaching .
Markscheme
* This sample question was produced by experienced DP mathematics senior examiners to aid teachers in preparing for external assessment in the new MAA course. There may be minor differences in formatting compared to formal exam papers.
M1
A1
[2 marks]
M1A1
AG
[2 marks]
A1A1
[2 marks]
Any valid reason for example: R1
Marked fish are randomly distributed, so constant.
Each fish caught is independent of previous fish caught
[1 mark]
M1
A1
AG
[2 marks]
M1A1
AG
[2 marks]
(M1)
and A1
[2 marks]
M1
Lower bound upper bound A1
[2 marks]
Linear model prediction falls outside this range so unlikely to be a good model R1A1
[2 marks]
M1
A1
M1
(M1)
A1
[5 marks]
M1A1
Note: Accept any answer that rounds to .
[2 marks]
This is much higher than the calculated upper bound for so the rate of growth of the fish is unlikely to be sufficient to reach a carrying capacity of . M1R1
[2 marks]
Examiners report
Syllabus sections
-
17M.2.SL.TZ1.T_4f:
In the context of this model, state what the value of 19 represents.
-
18M.2.SL.TZ2.S_6c:
Find when the seat is 30 m above the ground for the third time.
-
22M.2.SL.TZ2.4a.iii:
.
-
22M.2.SL.TZ2.4b:
Calculate the number of revolutions of the Ferris wheel per ride.
-
22M.1.AHL.TZ1.12b:
Find the value of .
-
22M.1.SL.TZ2.9b.ii:
Write down three simultaneous equations for and .
-
17M.1.SL.TZ1.T_15a:
Write down the value of .
-
22M.2.SL.TZ1.1b.i:
the amplitude.
-
22M.2.SL.TZ1.1b.ii:
the period.
-
22M.2.SL.TZ1.1b.iii:
the equation of the principal axis.
-
17N.2.SL.TZ0.S_10d:
A saw has a toothed edge which is 300 mm long. Find the number of complete teeth on this saw.
-
18N.2.SL.TZ0.T_4a:
Sketch the graph of y = f (x), for −4 ≤ x ≤ 3 and −50 ≤ y ≤ 100.
-
EXM.3.AHL.TZ0.9e:
Give two reasons why the prediction in part (b)(ii) might be lower than 14.
-
EXM.3.AHL.TZ0.9f.ii:
.
-
17M.2.SL.TZ1.T_3a:
Calculate .
-
EXM.3.AHL.TZ0.9b.i:
the number of new people infected on day 6.
-
18M.2.SL.TZ1.T_4e:
Sketch the graph of y = f (x) for 0 < x ≤ 6 and −30 ≤ y ≤ 60.
Clearly indicate the minimum point P and the x-intercepts on your graph. -
17M.1.SL.TZ1.T_15c:
Write down the second -intercept of the function.
-
18M.1.SL.TZ2.T_13b:
Find the value of s.
-
19N.1.SL.TZ0.T_11a:
Write down the number of Elvis impersonators in .
-
19N.2.SL.TZ0.T_4c:
Use the symmetry of the graph to show that the second solution is .
-
16N.1.SL.TZ0.S_1b:
(i) Write down the value of .
(ii) Find the value of .
-
EXM.3.AHL.TZ0.9a:
Use an exponential regression to find the value of and of , correct to 4 decimal places.
-
17M.2.SL.TZ2.S_4b:
Find the value of .
-
17M.2.SL.TZ1.T_6d.i:
Find .
-
17M.2.SL.TZ1.T_3c:
Write down the equation of the vertical asymptote.
-
22M.3.AHL.TZ1.1b.v:
By considering large values of write down one criticism of the model found in (b)(ii).
-
17M.1.SL.TZ2.T_14b:
Use your graphic display calculator to find how long it will take for Jashanti to have saved enough money to buy the car.
-
22M.3.AHL.TZ1.1b.ii:
Using the data in the table write down the equation for an appropriate non-linear regression model.
-
22M.3.AHL.TZ1.1c:
Use your answer from part (b)(ii) to estimate the time taken for the number of infected computers to double.
-
22M.3.AHL.TZ1.1d:
Find in which city, X or Y, the computer virus is spreading more easily. Justify your answer using your results from part (b).
-
22M.1.AHL.TZ1.12c:
Find the average number of earthquakes in a year with a magnitude of at least .
-
22M.1.SL.TZ2.9b.iii:
Hence, or otherwise, find the values of and .
-
22M.2.SL.TZ1.1c:
Hence or otherwise find the equation of this model in the form:
-
20N.1.SL.TZ0.T_11b:
Complete the table below placing a tick (✔) to show whether the unknown parameters and are positive, zero or negative. The row for has been completed as an example.

-
22M.2.SL.TZ2.4a.ii:
.
-
22M.2.AHL.TZ2.6c:
Assuming that the ground is horizontal and the ball is not hit by the arrow, find the coordinate of the point where the ball lands.
-
18N.2.SL.TZ0.T_4b.iii:
Use your graphic display calculator to find the equation of the tangent to the graph of y = f (x) at the point (–2, 38.75).
Give your answer in the form y = mx + c.
-
EXN.1.SL.TZ0.6a.iii:
Find the value of .
-
19N.1.SL.TZ0.T_2d:
An order of T-shirts will be charged the same price by both M-Line and EnYear.
Find the value of .
-
18N.1.SL.TZ0.S_8b:
Find the equation of the axis of symmetry of the graph of .
-
21M.1.SL.TZ1.7a:
Find the value of .
-
21M.1.SL.TZ1.7c:
State a mathematical reason why Professor Wei might believe this.
-
SPM.1.SL.TZ0.5a.ii:
Find the population of the Bulbul birds after 5 days.
-
21M.2.AHL.TZ1.4b.ii:
By considering the gradient of this curve when , explain why it may not be a good model.
-
EXN.3.AHL.TZ0.1a:
Use this model to predict the number of fish in the lake when .
-
21N.2.SL.TZ0.3f.ii:
The wind speed increases. The blades rotate at twice the speed, but still at a constant rate.
At any given instant, find the probability that Tim can see point from his window. Justify your answer.
-
22M.2.SL.TZ1.1a:
Write down one reason why a quadratic function would not be a good model for the number of hours of daylight per day, across a number of years.
-
21N.2.SL.TZ0.3e.ii:
Find the time, in seconds, that point is above a height of , during each complete rotation.
-
EXN.2.SL.TZ0.6f:
Hence find an expression for .
-
22M.1.SL.TZ2.12a:
Determine an equation for the axis of symmetry of the parabola that models the archway.
-
22M.1.SL.TZ2.12b:
Determine whether the crate will fit through the archway. Justify your answer.
-
22M.2.SL.TZ2.4a.i:
.
-
22M.1.SL.TZ2.9b.i:
Write down the value of .
-
22M.1.SL.TZ2.9c:
Use the model to determine the total length of time, in years, for which a graduate is expected to be in debt after graduating from university.
-
22M.1.SL.TZ1.11a:
Find the value of .
-
22M.1.SL.TZ1.11b:
Find the value of .
-
22M.1.SL.TZ1.11c:
Given , find the range for .
-
22M.1.SL.TZ1.3a:
Write down the height of the ball above the ground at the instant it is hit by the bat.
-
22M.1.SL.TZ1.3b:
Find the value of when the ball hits the ground.
-
22M.1.AHL.TZ1.12a:
Find the value of .
-
21N.1.SL.TZ0.13a.iii:
Hence find the equation of the quadratic curve.
-
21N.1.SL.TZ0.13a.ii:
Hence form two equations in terms of and .
-
21N.2.SL.TZ0.3c.i:
Write down the amplitude of the function.
-
21N.2.SL.TZ0.3e.i:
Find the height of above the ground when .
-
21N.2.AHL.TZ0.2d:
Sketch the function for , clearly labelling the coordinates of the maximum and minimum points.
-
16N.2.SL.TZ0.T_6b:
Express this volume in .
-
17M.2.SL.TZ1.T_4e:
Calculate, to the nearest second, the time since the pizza was taken out of the oven until it can be eaten.
-
19M.2.AHL.TZ1.H_10a:
Write down the maximum and minimum value of .
-
16N.2.SL.TZ0.T_1h:
Write down a reason why this estimate is not reliable.
-
18N.2.SL.TZ0.T_4b.i:
Use your graphic display calculator to find the zero of f (x).
-
19M.2.SL.TZ2.T_5f:
Find the equation of the tangent line to the graph of at . Give the equation in the form where, , , and .
-
18M.2.SL.TZ1.T_4a:
Find the value of k.
-
17M.1.SL.TZ2.T_14a:
Write down the amount of money Jashanti saves per month.
-
18M.1.SL.TZ1.T_12b:
Using this information, write down a second equation in terms of a and b.
-
18M.1.SL.TZ2.T_13c:
Find the number of shirts produced when the cost of production is lowest.
-
17N.1.SL.TZ0.T_12a:
Write down what the value of 150 represents in the context of the question.
-
18N.1.SL.TZ0.T_15c:
Write down the maximum amount of yeast in this solution.
-
17N.1.SL.TZ0.T_14b:
Find the point on the graph of at which the gradient of the tangent is equal to 6.
-
17M.2.SL.TZ2.T_6f:
Write down the number of possible solutions to the equation .
-
EXM.3.AHL.TZ0.9b.ii:
the day when the total number of people infected will be greater than 1000.
-
EXM.3.AHL.TZ0.9f.i:
.
-
EXM.3.AHL.TZ0.9f.iii:
.
-
18M.1.SL.TZ1.S_4a.i:
The equation of the axis of symmetry is x = p. Find p.
-
18M.1.SL.TZ2.T_10c:
Find the time since the experiment began for the bacteria population to be equal to 40A.
-
18M.1.SL.TZ1.T_12d:
The graph intersects the x-axis at a second point, P.
Find the x-coordinate of P.
-
19M.2.SL.TZ1.S_8b:
Find the range of .
-
19M.2.SL.TZ1.T_4b.ii:
State the domain of .
-
EXM.3.AHL.TZ0.9c:
Use your answer to part (a) to show that the model predicts 16.7 people will be infected on the first day.
-
18M.2.SL.TZ2.T_6f:
Given that y = 2x3 − 9x2 + 12x + 2 = k has three solutions, find the possible values of k.
-
18M.1.SL.TZ1.T_9a.i:
Find the number of fruit flies which were placed in the container.
-
SPM.2.SL.TZ0.5a.ii:
Find the values of and .
-
19M.2.SL.TZ1.S_8a:
The range of is ≤ ≤ . Find and .
-
18M.1.SL.TZ2.T_10a:
Find the value of A.
-
18M.1.SL.TZ2.T_13a:
Find the cost of producing 70 shirts.
-
17N.2.SL.TZ0.S_10b.ii:
Find the equation of .
-
18M.1.SL.TZ1.T_9a.ii:
Find the number of fruit flies that are in the container after 6 days.
-
18M.2.SL.TZ2.T_6a:
Sketch the curve for −1 < x < 3 and −2 < y < 12.
-
18M.1.SL.TZ1.T_12a:
Using only this information, write down an equation in terms of a and b.
-
18M.1.SL.TZ2.T_11a:
Write down the equation of the vertical asymptote.
-
17N.1.SL.TZ0.T_6c:
Find the value of and of .
-
18M.1.SL.TZ2.T_11b:
Write down the equation of the horizontal asymptote.
-
17N.2.SL.TZ0.T_5b.ii:
Find .
-
16N.2.SL.TZ0.T_1f:
Draw the regression line, from part (e), on your scatter diagram.
-
SPM.1.SL.TZ0.5a.i:
Find the population of the Bulbul birds at the start of the migration season.
-
SPM.2.SL.TZ0.5d:
Hence, identify why Model A may not be appropriate at lower speeds.
-
17N.2.SL.TZ0.S_10a:
Show that .
-
19M.2.SL.TZ1.S_8d:
The equation has two solutions where ≤ ≤ . Find both solutions.
-
17N.1.SL.TZ0.T_12b:
Find the value of .
-
17M.2.SL.TZ2.T_6d.i:
Write down the -coordinates of these two points;
-
18M.2.SL.TZ2.T_6b:
A teacher asks her students to make some observations about the curve.
Three students responded.
Nadia said “The x-intercept of the curve is between −1 and zero”.
Rick said “The curve is decreasing when x < 1 ”.
Paula said “The gradient of the curve is less than zero between x = 1 and x = 2 ”.State the name of the student who made an incorrect observation.
-
17M.2.SL.TZ1.T_3d:
Write down the coordinates of the -intercept.
-
17M.2.SL.TZ1.T_3f:
Find the solution of .
-
17M.2.SL.TZ2.T_6a:
Write down the -intercept of the graph.
-
SPM.1.SL.TZ0.5c:
According to this model, find the smallest possible population of Bulbul birds during the migration season.
-
17N.1.SL.TZ0.T_14a:
Write down the derivative of .
-
17M.2.SL.TZ1.S_8a.i:
How much time is there between the first low tide and the next high tide?
-
17M.2.SL.TZ1.T_6d.ii:
Hence justify that is decreasing at .
-
18N.1.SL.TZ0.S_8c.ii:
Find the value of .
-
19M.1.SL.TZ2.T_13a:
Find the value of .
-
17M.2.SL.TZ2.T_6c.ii:
Find .
-
SPM.2.SL.TZ0.5f:
Calculate the percentage error in the estimate in part (e).
-
17M.2.SL.TZ1.T_3b:
Sketch the graph of for and .
-
17N.1.SL.TZ0.T_15b:
Find how much Maria earns in one week, from selling cheese, if the price of a kilogram of cheese is 8 EUR.
-
18M.2.SL.TZ1.T_4b:
Using your value of k , find f ′(x).
-
18M.1.SL.TZ2.T_14c:
Find the x-coordinate of the point at which the normal to the graph of f has gradient .
-
18N.1.SL.TZ0.T_11b:
Find the gradient of this tangent at point P.
-
16N.2.SL.TZ0.S_10a:
(i) Find the value of .
(ii) Show that .
(iii) Find the value of .
-
SPM.2.SL.TZ0.5c:
Using the values in the table and your answer to part (b), sketch the graph of for 0 ≤ ≤ 10 and −10 ≤ ≤ 60, clearly showing the vertex.
-
19M.2.SL.TZ1.S_8c.ii:
Find the period of .
-
18N.1.SL.TZ0.T_11a:
Find .
-
19M.2.AHL.TZ1.H_10g:
Given that can be written as where , , , > 0, use your graph to find the values of , , and .
-
19M.2.AHL.TZ1.H_10c:
Sketch the graph of for 0 ≤ ≤ 0.02 , showing clearly the coordinates of the first maximum and the first minimum.
-
EXM.3.AHL.TZ0.9h:
Use the logistic model to find the day when the rate of increase of people infected is greatest.
-
19N.2.SL.TZ0.T_4b:
Write down the equation for the axis of symmetry of the graph.
-
21M.2.SL.TZ1.2g:
Find the value of when .
-
19N.2.SL.TZ0.T_4d:
Write down the -intercepts of the graph.
-
19M.1.SL.TZ2.T_15a:
Find the value of if no vases are sold.
-
18N.2.SL.TZ0.T_4b.ii:
Use your graphic display calculator to find the coordinates of the local minimum point.
-
18M.1.SL.TZ2.T_10b:
Interpret what A represents in this context.
-
19N.1.SL.TZ0.T_2b:
Find the total amount charged for an order of T-shirts.
-
19N.2.SL.TZ0.T_4f.ii:
Draw the tangent on your graph.
-
SPM.1.SL.TZ0.5b:
Calculate the time taken for the population to decrease below 1400.
-
19N.1.SL.TZ0.T_11c:
Calculate the number of Elvis impersonators when .
-
17M.2.SL.TZ1.T_4b:
Find the radius of the sphere in cm, correct to one decimal place.
-
16N.2.SL.TZ0.S_6b:
The empty barrel is being filled with water. The volume of water in the barrel after minutes is given by . How long will it take for the barrel to be half-full?
-
EXM.3.AHL.TZ0.9d.ii:
Perform a goodness of fit test at the 5% significance level. You should clearly state your hypotheses, the p-value, and your conclusion.
-
EXM.3.AHL.TZ0.9d.i:
Explain why the number of degrees of freedom is 2.
-
16N.2.SL.TZ0.T_1a:
On graph paper, draw a scatter diagram for these data. Use a scale of 2 cm to represent 5 hours on the -axis and 2 cm to represent 10 points on the -axis.
-
16N.1.SL.TZ0.T_15a:
Write down, and simplify, an expression for the car’s value when Gabriella purchased it.
-
19M.1.SL.TZ2.T_13c:
There is a number beyond which the turtle population will not decrease.
Find the value of . Justify your answer.
-
18M.1.SL.TZ2.T_6c:
Line L3 is parallel to line L2 and passes through the point (2, 3).
Find the equation of line L3. Give your answer in the form y = mx + c.
-
17M.2.SL.TZ2.T_6c.i:
Show that .
-
SPM.2.SL.TZ0.5b:
Find the coordinates of the vertex of the graph of .
-
17M.2.SL.TZ1.S_8c:
There are two high tides on 12 December 2017. At what time does the second high tide occur?
-
18M.1.SL.TZ2.T_14a:
Find f'(x)
-
EXM.3.AHL.TZ0.9g:
Hence predict the total number of people infected by this disease after several months.
-
SPM.2.SL.TZ0.5e:
Use Model B to calculate an estimate for the braking distance at a speed of .
-
17M.2.SL.TZ2.S_4c:
Use the model to find the depth of the water 10 hours after high tide.
-
17N.2.SL.TZ0.T_5b.i:
Expand the expression for .
-
17M.1.SL.TZ2.T_14c:
Calculate how much extra money Jashanti needs.
-
17M.2.SL.TZ1.T_4a:
Calculate the volume of this pan.
-
17N.2.SL.TZ0.S_10c:
Show that the distance between the -coordinates of and is .
-
18M.1.SL.TZ1.T_9b:
The maximum capacity of the container is 8000 fruit flies.
Find the number of days until the container reaches its maximum capacity.
-
17M.2.SL.TZ1.S_8b.i:
Find the value of ;
-
SPM.2.SL.TZ0.5a.i:
Write down a second equation to represent Model A, when the speed is .
-
19M.2.SL.TZ1.T_4e:
This straight road crosses the highway and then carries on due north.
State whether the straight road will ever cross the river. Justify your answer.
-
17M.2.SL.TZ1.T_6b.ii:
Find the equation of the tangent to the graph of at . Give your answer in the form .
-
19M.1.SL.TZ2.T_15b:
Differentiate .
-
17M.2.SL.TZ1.T_4d:
Find the temperature that the pizza will be 5 minutes after it is taken out of the oven.
-
17N.2.SL.TZ0.T_5e:
Write down the coordinates of the point of intersection.
-
19N.2.SL.TZ0.T_4e:
On graph paper, draw the graph of for and . Use a scale of to represent unit on the -axis and to represent units on the -axis.
-
18M.1.SL.TZ1.T_12c:
Hence find the value of a and of b.
-
19M.2.SL.TZ1.S_8c.i:
Find the value of and of .
-
17M.2.SL.TZ2.T_6d.ii:
Write down the intervals where the gradient of the graph of is positive.
-
16N.2.SL.TZ0.T_6f:
Using your answer to part (e), find the value of which minimizes .
-
19M.2.AHL.TZ1.H_10e:
Find (0.007).
-
20N.2.SL.TZ0.S_4b.i:
Solve the equation .
-
20N.1.SL.TZ0.T_12c:
Find Jean-Pierre’s vertical speed after seconds. Give your answer in .
-
20N.2.SL.TZ0.S_4b.ii:
Hence or otherwise, given that , find the value of .
-
20N.1.SL.TZ0.T_12a:
Find the value of .
-
20N.1.SL.TZ0.T_12b:
In the context of the model, state what the horizontal asymptote represents.
-
17N.1.SL.TZ0.T_6b:
Use this ratio to write down in terms of .
-
19N.2.SL.TZ0.T_4f.i:
Write down the equation of .
-
18M.1.SL.TZ2.T_6a:
Find the value of a.
-
20N.1.SL.TZ0.T_11a:
Write down the other solution of .
-
19M.1.SL.TZ2.T_13b:
Find the time, in years, for the population to decrease to 20 turtles.
-
17M.2.SL.TZ2.T_6g:
The equation , where , has four solutions. Find the possible values of .
-
19N.1.SL.TZ0.T_11d:
The world population in is projected to be people.
Use this information to explain why the model for the number of Elvis impersonators is unrealistic.
-
16N.2.SL.TZ0.S_10b:
(i) Write down the value of .
(ii) Find .
-
18N.1.SL.TZ0.T_11c:
Find the equation of this tangent. Give your answer in the form y = mx + c.
-
EXN.1.SL.TZ0.2b:
Find, to the nearest USD, the cost of disk that has a radius of cm.
-
16N.2.SL.TZ0.T_6e:
Find .
-
16N.2.SL.TZ0.T_1b:
(i) , the mean number of hours spent on social media;
(ii) , the mean number of IB Diploma points.
-
17N.2.SL.TZ0.T_5c:
Use your answer to part (b)(ii) to find the values of for which is increasing.
-
EXN.1.SL.TZ0.6a.ii:
Find the value of .
-
EXN.1.SL.TZ0.6b:
Find the value of at which the population first reaches .
-
18M.2.SL.TZ2.T_6d:
Find .
-
17N.2.SL.TZ0.T_5a:
Find the exact value of each of the zeros of .
-
17M.2.SL.TZ2.T_6b:
Find .
-
17M.1.SL.TZ1.T_15b:
Find the value of and of .
-
17M.2.SL.TZ1.T_6b.i:
Show that .
-
21M.2.AHL.TZ1.2c:
Use the trapezoidal rule, with three intervals, to estimate the cross-sectional area of the tunnel.
-
17M.2.SL.TZ1.T_6a:
Find .
-
19N.1.SL.TZ0.T_2a:
Write down the initial design fee charged for each order.
-
18M.1.SL.TZ2.T_11c:
Calculate the value of x for which f(x) = 0 .
-
21M.1.SL.TZ1.4a:
Find the total cost of buying litres of gas at Leon’s gas station.
-
17N.1.SL.TZ0.T_15a:
Write down how many kilograms of cheese Maria sells in one week if the price of a kilogram of cheese is 8 EUR.
-
18M.2.SL.TZ1.T_4c:
Use your answer to part (b) to show that the minimum value of f(x) is −22 .
-
21M.1.SL.TZ2.12c:
Write down the equation of the axis of symmetry of the graph.
-
21M.1.SL.TZ1.4b:
Find .
-
16N.1.SL.TZ0.S_1a:
Find the equation of the axis of symmetry of the graph of .
-
16N.2.SL.TZ0.T_1g:
Use the given equation of the regression line to estimate the number of IB Diploma points that this girl obtained.
-
19M.2.SL.TZ2.T_5d:
Find .
-
17M.2.SL.TZ2.T_6e:
Write down the range of .
-
19N.1.SL.TZ0.T_11b:
Calculate the time taken for the number of Elvis impersonators to reach .
-
17N.1.SL.TZ0.T_15d:
Find the price, , that will give Maria the highest weekly profit.
-
21M.1.SL.TZ1.7b:
Use this model to find the percentage of information retained by his students hours after Professor Wei’s lecture.
-
17N.1.SL.TZ0.T_15c:
Write down an expression for in terms of .
-
19M.2.SL.TZ1.T_4d:
Find the distance from the centre of Orangeton to the point at which the road meets the highway.
-
17N.2.SL.TZ0.S_10b.i:
Find the coordinates of and of .
-
16N.2.SL.TZ0.T_1c:
Plot the point on your scatter diagram and label this point M.
-
17N.1.SL.TZ0.T_6a:
Use this information to write down an equation involving and .
-
20N.1.SL.TZ0.T_11c:
State the values of for which is decreasing.
-
19M.2.AHL.TZ1.H_10b:
Write down two transformations that will transform the graph of onto the graph of .
-
19M.2.AHL.TZ1.H_10d:
Find the total time in the interval 0 ≤ ≤ 0.02 for which ≥ 3.
-
16N.1.SL.TZ0.T_15b:
Find the value of .
-
18M.1.SL.TZ2.T_14b:
Find the gradient of the graph of f at .
-
21M.1.SL.TZ1.11a:
Show that .
-
17M.2.SL.TZ1.T_3e:
Write down the possible values of for which and .
-
17M.2.SL.TZ1.T_6e:
Find the -coordinate of the local minimum.
-
16N.2.SL.TZ0.T_6c:
Write down, in terms of and , an equation for the volume of this water container.
-
17N.2.SL.TZ0.T_5d:
Draw the graph of for and . Use a scale of 2 cm to represent 1 unit on the -axis and 1 cm to represent 5 units on the -axis.
-
19N.1.SL.TZ0.T_2c:
Write down the number of T-shirts in an order for which EnYear charged euros.
-
18M.1.SL.TZ2.T_6b:
Find the coordinates of R.
-
16N.2.SL.TZ0.T_6a:
Write down a formula for , the surface area to be coated.
-
16N.2.SL.TZ0.T_6h:
Find the least number of cans of water-resistant material that will coat the area in part (g).
-
21M.1.SL.TZ1.11b:
Sketch the curve of on the axes below showing clearly the point .

-
18M.1.SL.TZ2.S_6:
Let , where p ≠ 0. Find Find the number of roots for the equation .
Justify your answer.
-
19N.2.SL.TZ0.T_4a:
Find the value of .
-
20N.2.SL.TZ0.S_4a:
Find .
-
16N.1.SL.TZ0.T_15c:
Find the value of .
-
17M.2.SL.TZ1.T_4c:
Find the value of .
-
17M.2.SL.TZ1.T_6c:
Use your answer to part (a) and the value of , to find the -coordinates of the stationary points of the graph of .
-
21M.2.SL.TZ1.2h:
Write down the amplitude of .
-
21M.2.SL.TZ1.5a.ii:
Hence find the maximum height of the tunnel.
-
21M.2.SL.TZ1.5a.i:
Find .
-
21M.2.AHL.TZ1.2b.ii:
.
-
21M.2.AHL.TZ1.2b.i:
.
-
21M.2.AHL.TZ1.4b.i:
Find the equation of the least squares regression quadratic curve for these four points.
-
16N.2.SL.TZ0.S_6a:
Use the model to find the volume of the barrel.
-
21M.2.AHL.TZ1.2d.ii:
Hence find the cross-sectional area of the tunnel.
-
21M.2.SL.TZ1.5b:
Use the trapezoidal rule, with three intervals, to estimate the cross-sectional area of the tunnel.
-
21M.2.AHL.TZ1.2a.i:
Find .
-
21M.2.AHL.TZ1.2a.ii:
Hence find the maximum height of the tunnel.
-
21M.2.AHL.TZ1.4c:
Find the equation of the new model.
-
19N.2.SL.TZ0.T_4g:
Given and , state whether the function, , is increasing or decreasing at . Give a reason for your answer.
-
EXN.1.SL.TZ0.2a:
Find an equation which links and .
-
17M.2.SL.TZ1.S_8b.iii:
Find the value of .
-
17N.1.SL.TZ0.T_12c:
Find the total time that the baking tin is in the oven.
-
16N.2.SL.TZ0.T_1e:
Write down the equation of the regression line on for these eight male students.
-
16N.2.SL.TZ0.T_6d:
Show that .
-
18N.1.SL.TZ0.S_8c.i:
Write down the value of .
-
16N.2.SL.TZ0.S_10c:
(i) Find .
(ii) Hence or otherwise, find the maximum positive rate of change of .
-
21M.1.SL.TZ2.1b:
Calculate the amount of the drug remaining in the body hours after the injection.
-
21M.1.SL.TZ2.1a.i:
the initial dose of the drug.
-
21M.1.SL.TZ2.1a.ii:
the percentage of the drug that leaves the body each hour.
-
21M.1.SL.TZ1.7d:
Write down one possible limitation of the domain of the model.
-
SPM.2.SL.TZ0.5g:
It is found that once a driver realizes the need to stop their vehicle, 1.6 seconds will elapse, on average, before the brakes are engaged. During this reaction time, the vehicle will continue to travel at its original speed.
A truck approaches an intersection with speed . The driver notices the intersection’s traffic lights are red and they must stop the vehicle within a distance of .

Using model B and taking reaction time into account, calculate the maximum possible speed of the truck if it is to stop before the intersection.
-
21M.1.SL.TZ2.12a:
Find the value of .
-
17M.1.SL.TZ2.T_15:
Consider the following graphs of quadratic functions.
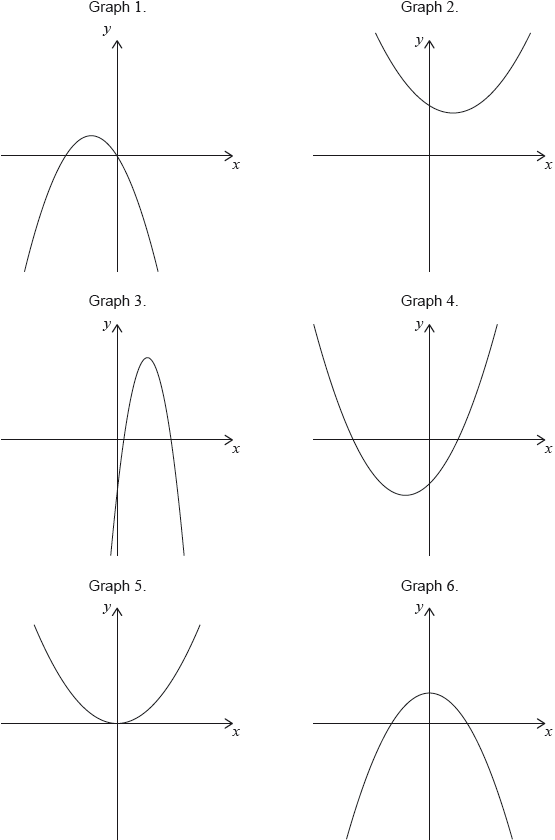
The equation of each of the quadratic functions can be written in the form , where .
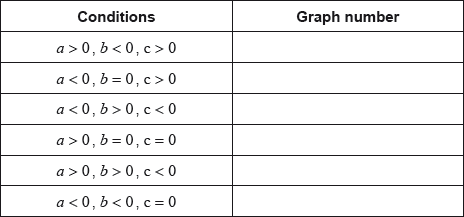
Each of the sets of conditions for the constants , and , in the table below, corresponds to one of the graphs above.
Write down the number of the corresponding graph next to each set of conditions.
-
17N.1.SL.TZ0.T_11c:
Find the value of and of .
-
17M.2.SL.TZ2.S_4a:
Find the value of .
-
21M.1.SL.TZ2.12b:
Find the value of
(i) .
(ii) .
(iii) .
-
16N.2.SL.TZ0.T_6g:
Find the value of this minimum area.
-
18M.1.SL.TZ1.S_4a.ii:
Hence, show that a = 2.
-
17M.2.SL.TZ1.S_8b.ii:
Find the value of ;
-
19M.2.AHL.TZ1.H_10f:
With reference to your graph of explain why > 0 for all > 0.
-
EXN.1.SL.TZ0.6a.i:
Find the value of .
-
18N.1.SL.TZ0.S_8d:
The graph of a second function, , is obtained by a reflection of the graph of in the -axis, followed by a translation of .
Find the coordinates of the vertex of the graph of .
-
17M.2.SL.TZ1.S_8a.ii:
Find the difference in height between low tide and high tide.
-
19M.2.SL.TZ2.T_5e:
Find the gradient of the graph of at .
-
21M.2.SL.TZ1.5c.i:
Write down the integral which can be used to find the cross-sectional area of the tunnel.
-
21M.2.SL.TZ1.5c.ii:
Hence find the cross-sectional area of the tunnel.
-
21M.2.AHL.TZ1.2d.i:
Write down the integral which can be used to find the cross-sectional area of the tunnel.
-
21N.1.SL.TZ0.13b:
Find the area of the shaded region in Irina’s design.
-
21N.2.AHL.TZ0.2a.ii:
minimum value of .
-
EXN.2.AHL.TZ0.4d:
Find the equation for Jorge’s model.
-
21N.1.SL.TZ0.3b:
Find the value of .
-
21N.1.SL.TZ0.13a.i:
Write down the value of .
-
21N.2.AHL.TZ0.2b.i:
Find the time, in seconds, it takes for the blade to make one complete rotation under these conditions.
-
21N.2.SL.TZ0.3a.i:
maximum value of .
-
21N.2.SL.TZ0.3a.ii:
minimum value of .
-
21N.2.SL.TZ0.3b.i:
Find the time, in seconds, it takes for the blade to make one complete rotation under these conditions.
-
21N.2.SL.TZ0.3b.ii:
Calculate the angle, in degrees, that the blade turns through in one second.
-
21N.2.SL.TZ0.3c.ii:
Find the period of the function.
-
21N.2.SL.TZ0.3d:
Sketch the function for , clearly labelling the coordinates of the maximum and minimum points.
-
21N.2.SL.TZ0.3f.i:
At any given instant, find the probability that point is visible from Tim’s window.
-
21N.1.SL.TZ0.3a:
Write down the value of .
-
21N.2.AHL.TZ0.2a.i:
maximum value of .
-
21N.2.AHL.TZ0.2b.ii:
Calculate the angle, in degrees, that the blade turns through in one second.
-
21N.2.AHL.TZ0.2c.i:
Write down the amplitude of the function.
-
21N.2.AHL.TZ0.2c.ii:
Find the period of the function.
-
21N.2.AHL.TZ0.2e.i:
Find the height of above the ground when .
-
21N.2.AHL.TZ0.2e.ii:
Find the time, in seconds, that point is above a height of , during each complete rotation.
-
21N.2.AHL.TZ0.2f:
The wind speed increases and the blades rotate faster, but still at a constant rate.
Given that point is now higher than for second during each complete rotation, find the time for one complete rotation.