4.1 Statistical concepts

Statistics are so powerful because they allow us to create meaning from data. In this chapter we will learn the differences between types of data, how to choose useful samples, and how to recognise outliers in data.

Key Concepts

In this unit you should learn to…

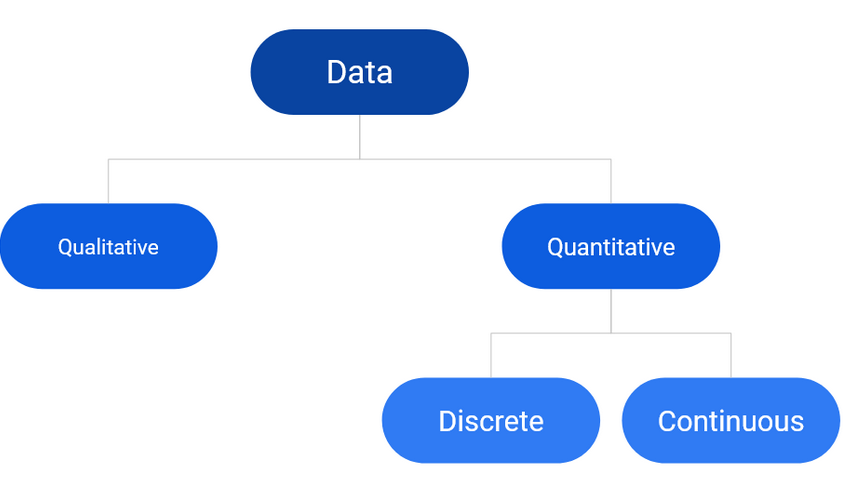
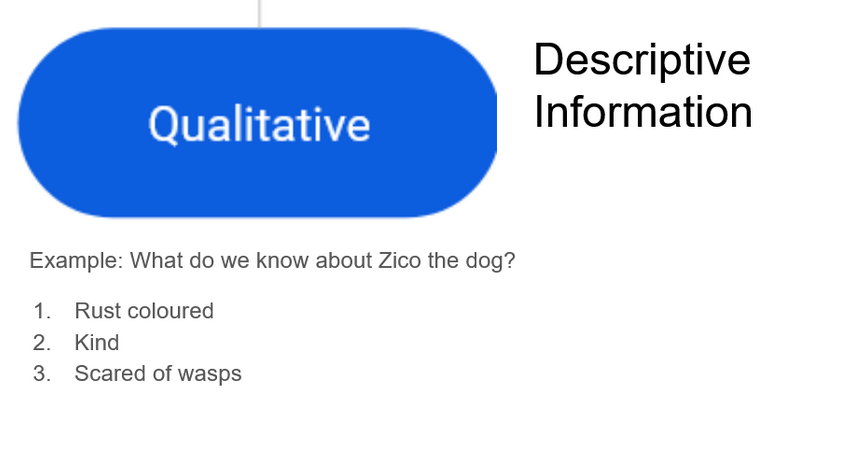
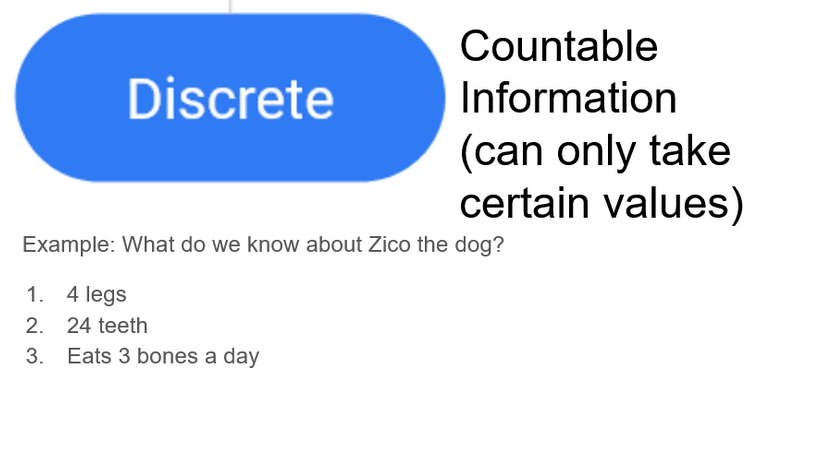
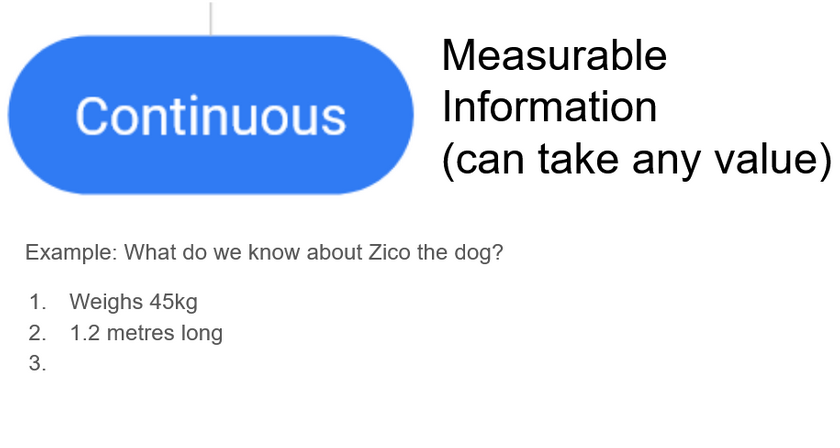
  • recognise the difference between discrete and continuous data

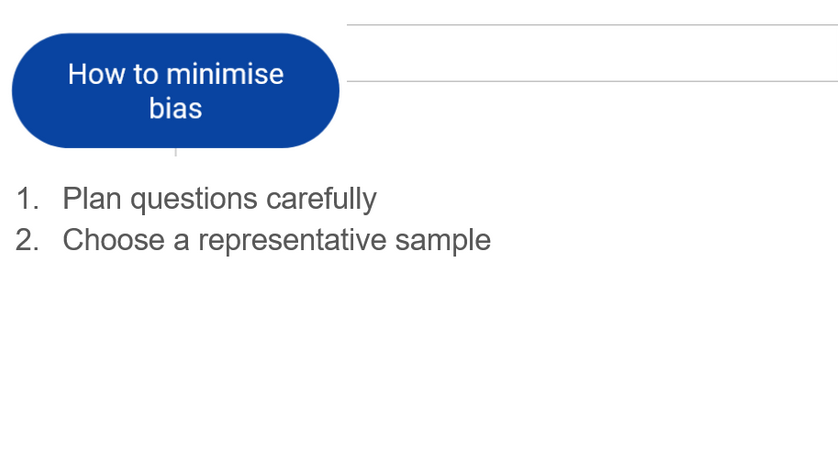
  • be able to minimise the bias in your data

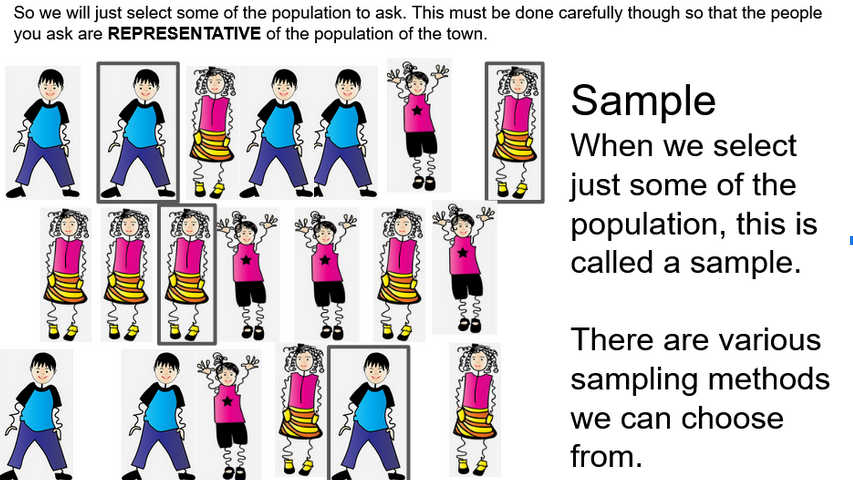
  • take a sample of data in order to analyse it

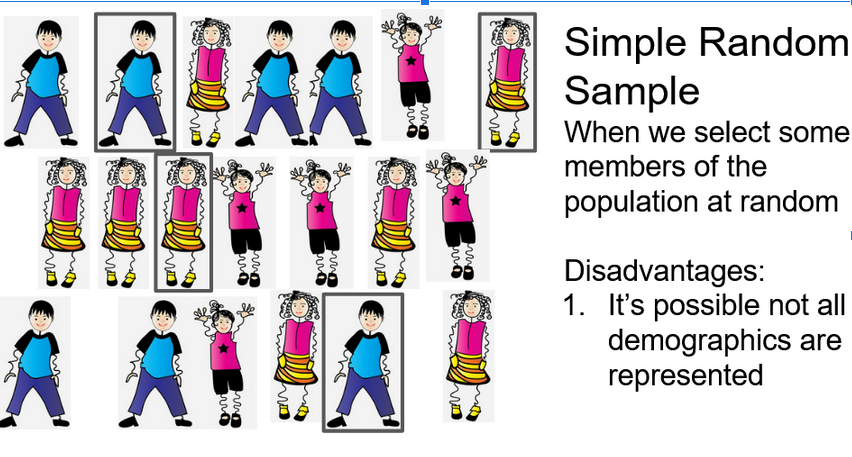
  • recognise difference types of sampling

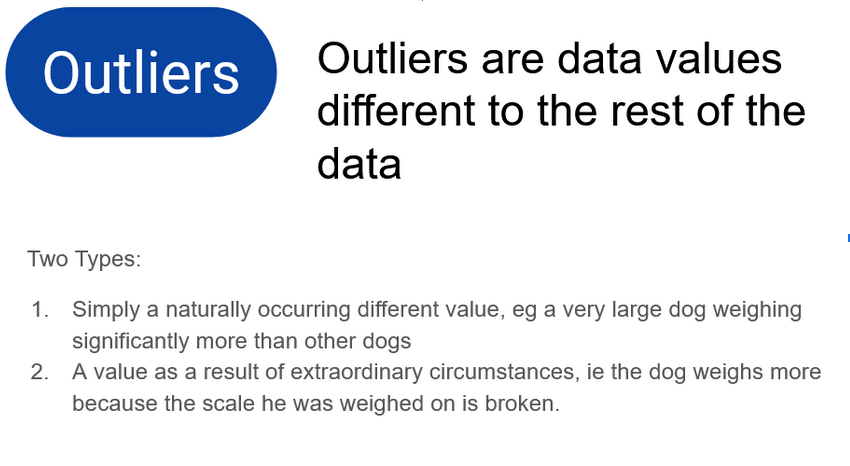
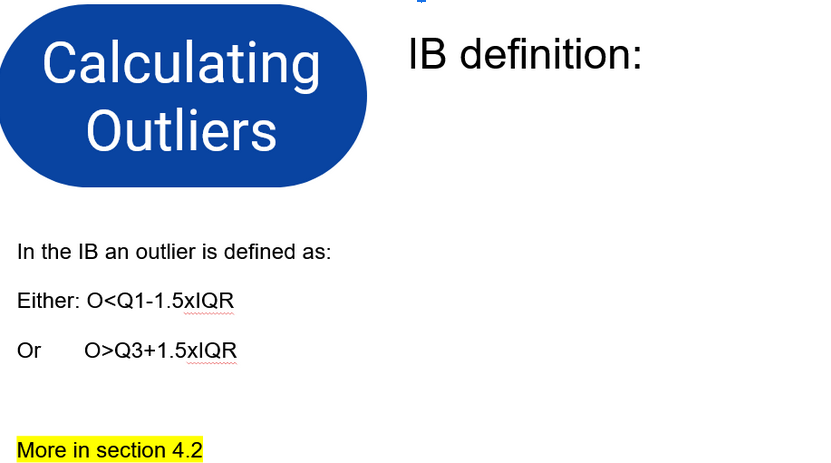
  • find outliers of a set of data

Essentials

1. Types of Data

Discrete and Continuous Data, what is a data, how do we ensure we minimise bias in our data?

2. Sampling vs Population

Why might you want to take a sample of your data? How do we collect a representative sample? What types of sample are there?

3. Outliers and Anomalies

What is the difference between an outlier and an anomaly? How could you recognise one? What are some examples of potential outliers?


Summary

Test yourself

Self Checking Quiz


Exam Style Questions

The following questions are based on IB exam style questions from past exams. You should print these off (from the document at the top) and try to do these questions under exam conditions. Then you can check your work with the video solution.

Question 1

A headteacher wants to find out in how many subjects students have Internal Assessments (IA). He conducts a survey:


Number of subjects with IAs

0

1

2

3

4

5

6

Number of students

15

20

20

32

30

17

16


  1. State whether the data is discrete or continuous (1)

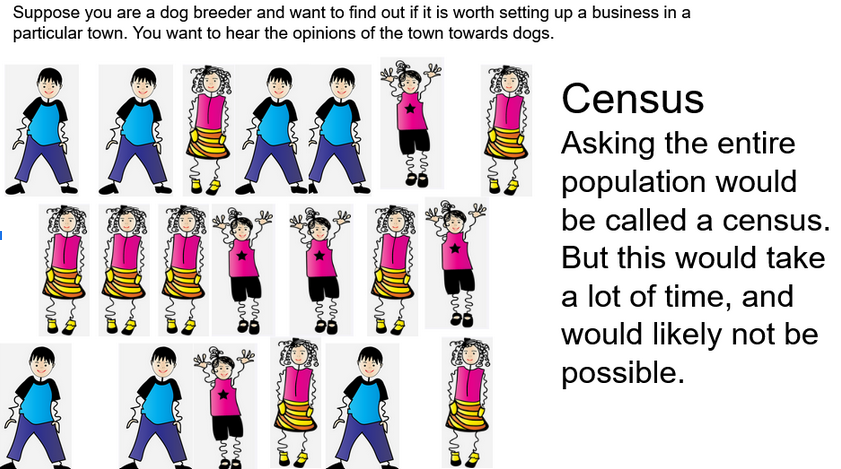
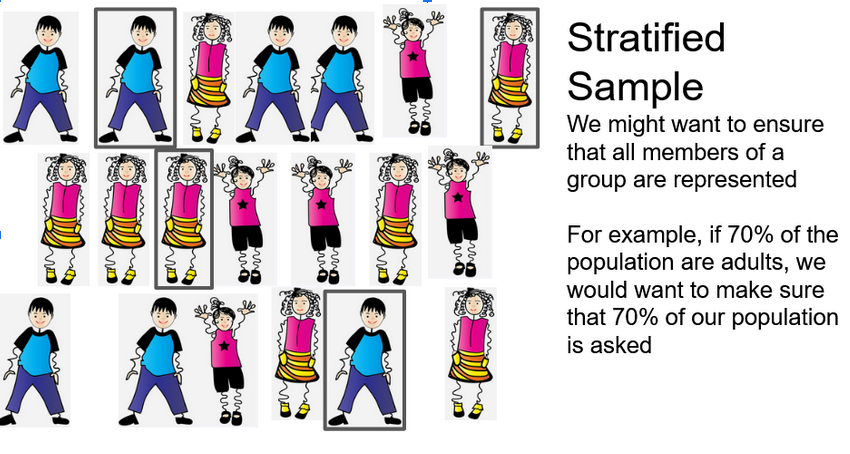
  2. It was not possible to ask the whole school, so he conducts a survey. The school is 55% boys and 45% girls, so he makes sure his sample includes 55% boys and 45% girls. What type of sampling does he use? (1)

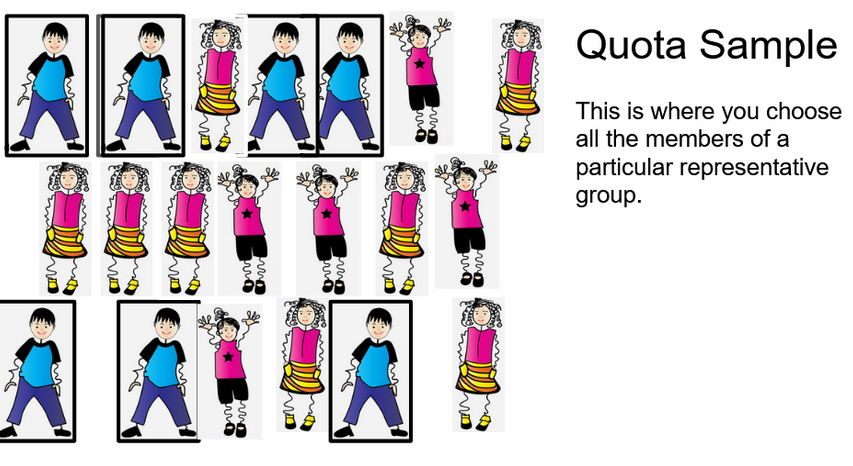
  3. He then wants to investigate further, so asks all the students that are studying Geography. What type of sampling is this? (1)

  4. The coursework marks of the students studying Geography are listed below. 

    1. Identify the outlier

    2. By removing the outlier, calculate the new mean (3)


45%

39%

46%

29%

39%

43%

42%

48%

39%

41%


(6 marks)

Video Solution

Question 2

A reservoir contains 3 types of fish. There are estimated to be 700 carp, 500 bass and 300 pike. A survey of the fish is taken, and a sample of 50 is used. 

a)Explain why a simple random sample would not be appropriate (1)

b)Name a potential sampling method that could be used (1)

c) Give one advantage and one disadvantage of this method (2)

d) Explain briefly how you could conduct this survey (3)


(7 marks)

Video Solution

Question 3

A survey of hours taken revising for a test is conducted by a teacher. She asks all the students in her Grade 12 class: “Revising hard will make you do better in this exam. How many hours did you revise?”

a)What type of sampling did the teacher use? (1)

b) Her question might have made her results unreliable. Suggest what change could be made, and why. (2)

The table shows the answers that her students gave. 


0

0

1

1

2

5

5

8

9

50


c)Showing your working, identify the outlier and explain whether or not you think the value should be included in the teacher’s analysis. (5)


                                                                                                                                            (8 marks)

Video Solution

MY PROGRESS

How much of 4.1 Statistical concepts have you understood?