
Mean, Mode, Median, Range, Variance, Standard Deviation
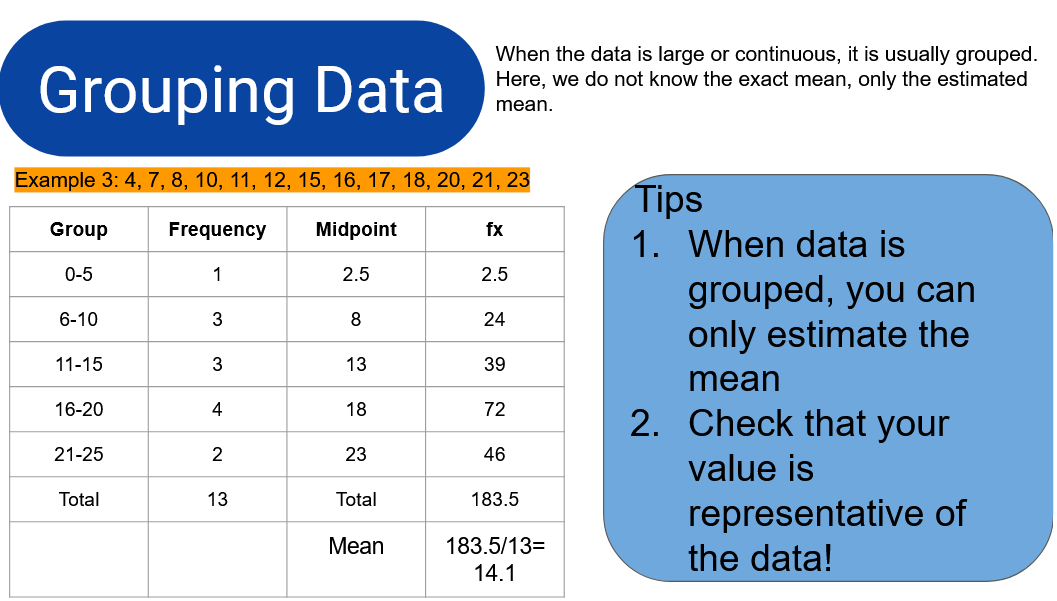
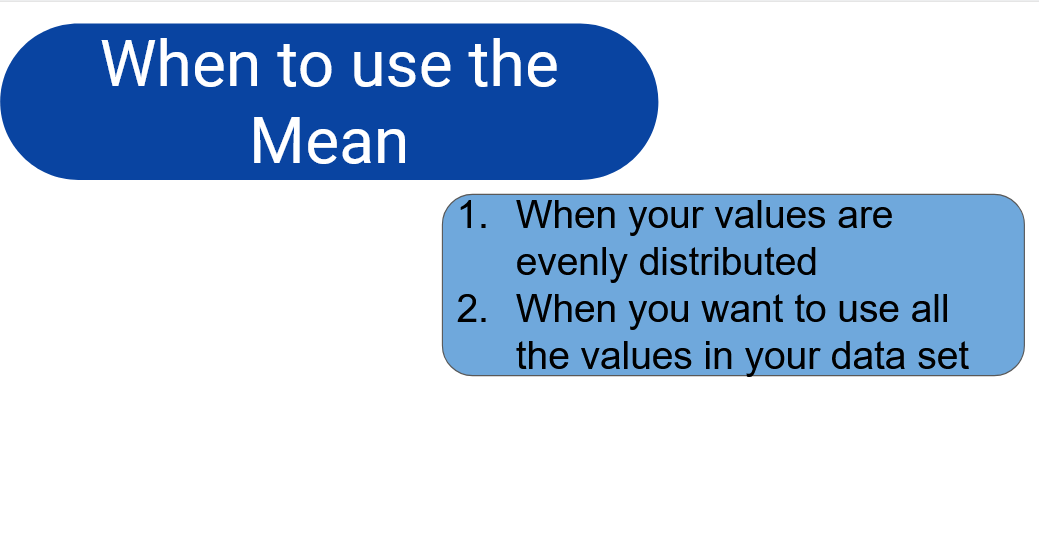
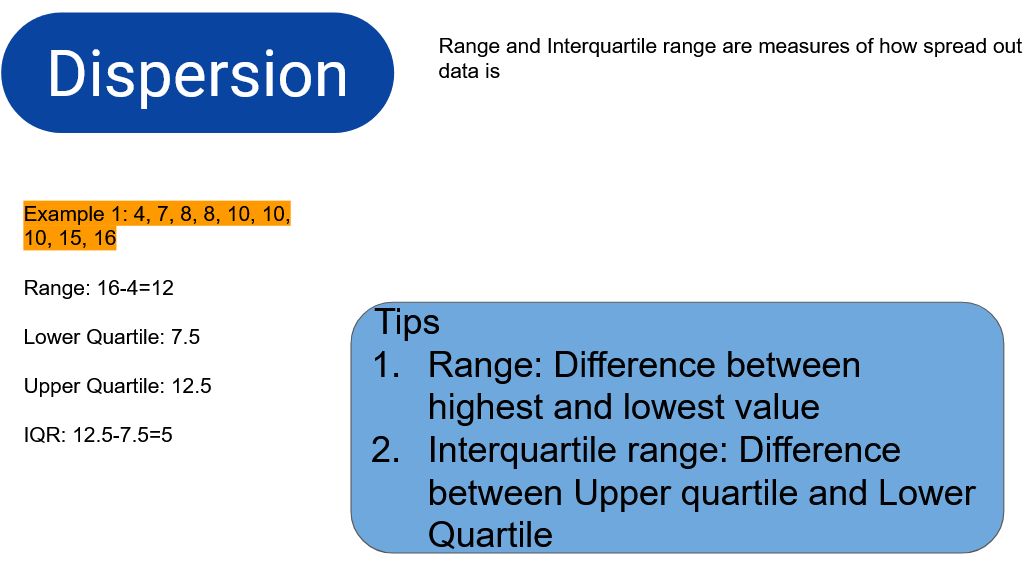
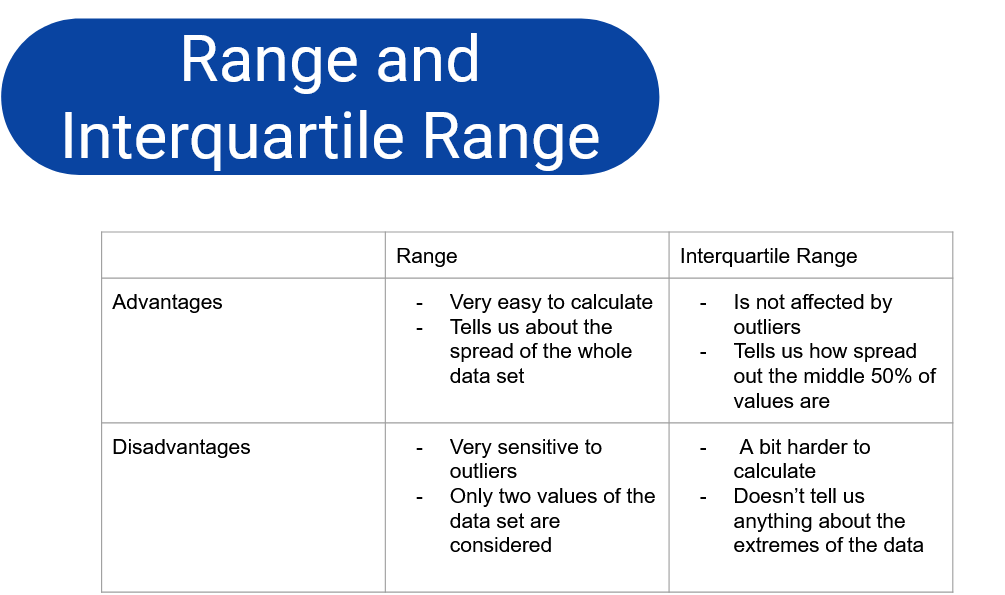
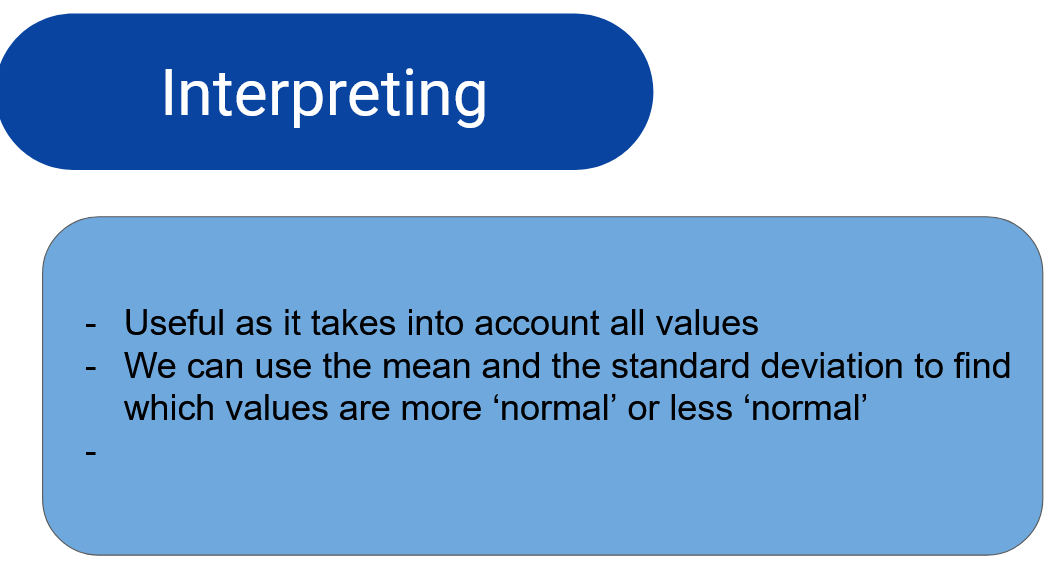
Measures of central tendency, such as the mean, median and mode, are very useful ways of representing large amounts of data with just one value. They can be very useful in forming conclusions about data, but they can also misrepresent data and hide information. Measures of dispersion, such as range, interquartile range, variance and standard deviation are ways of representing how spread out the data is.
In this unit you should learn to…
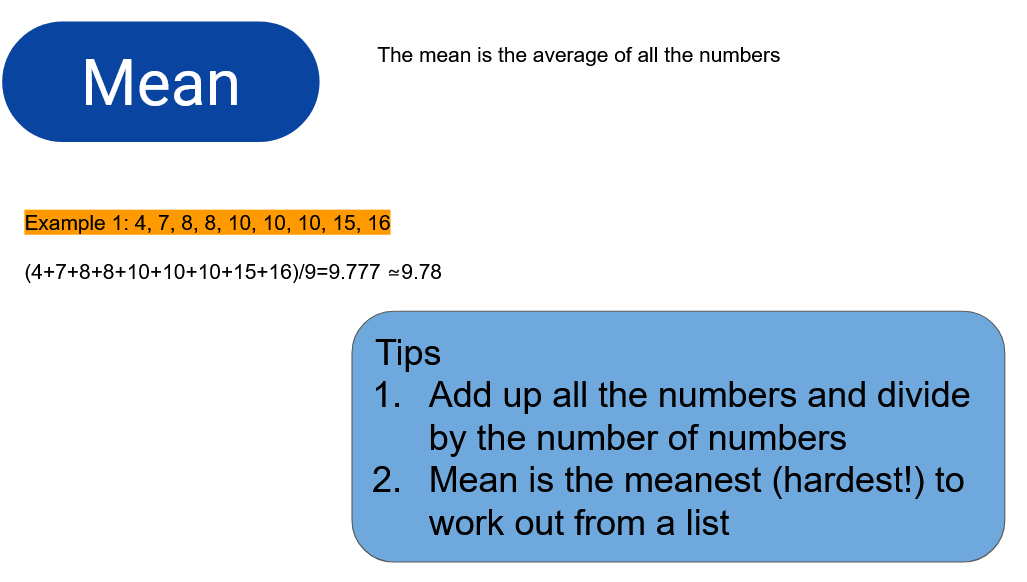
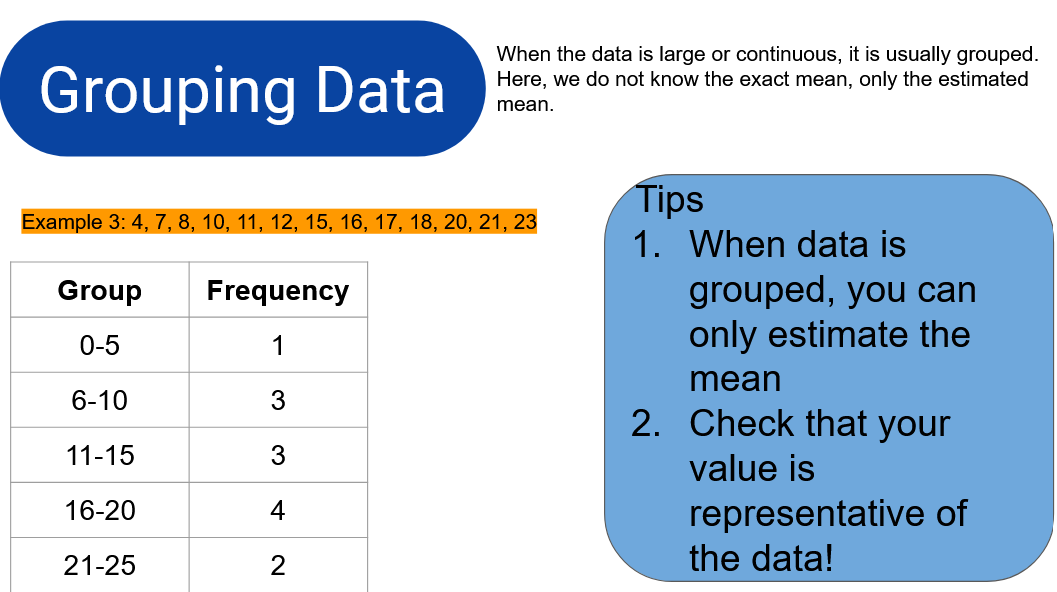
- Find the mode, median and mean of a set of data
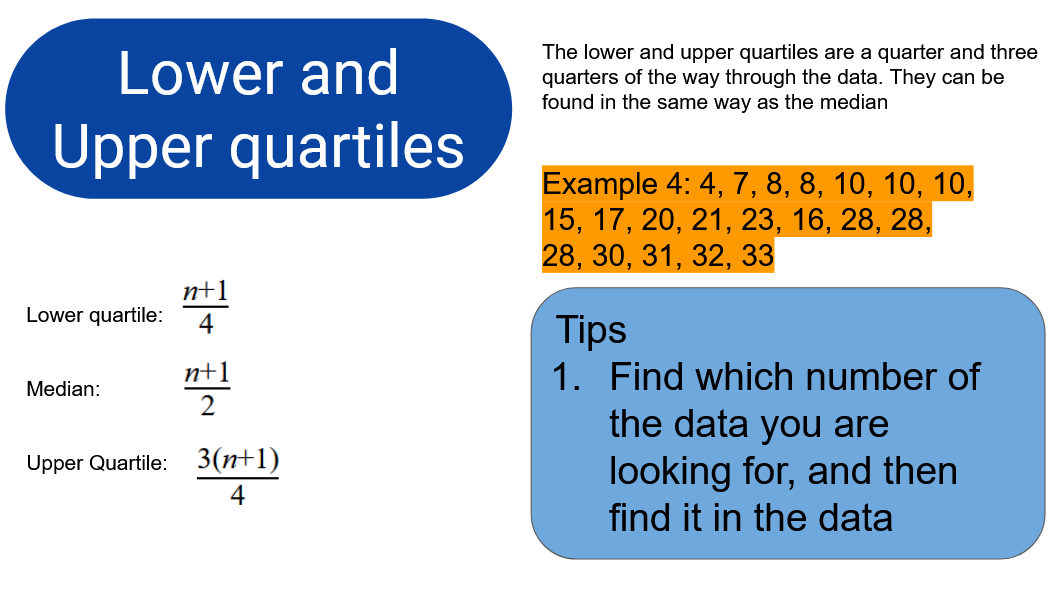
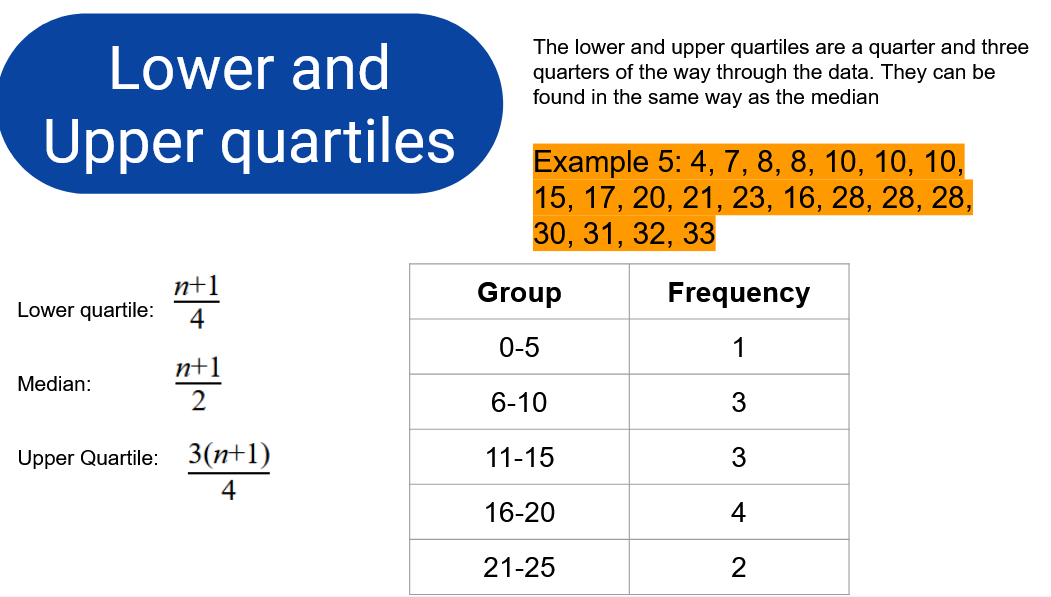
- Find the range and interquartile range of a set of data
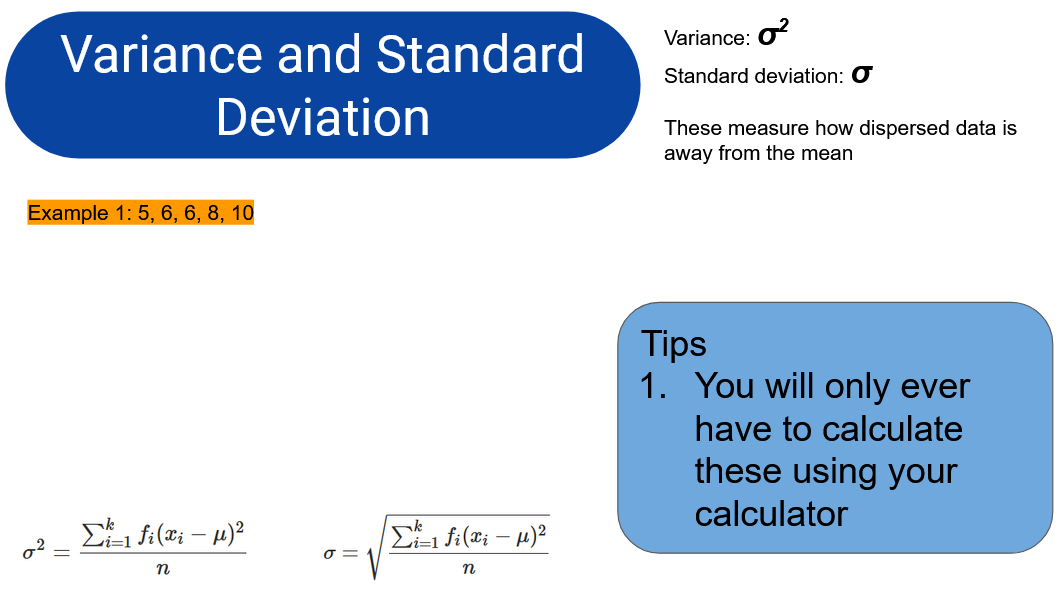
- Find the variance and standard deviation of a set of data
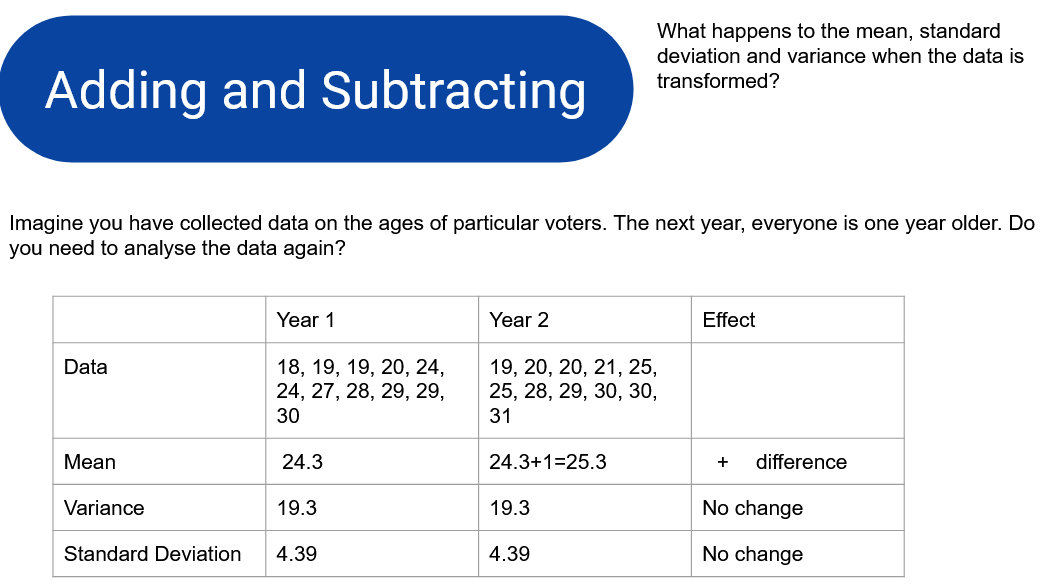
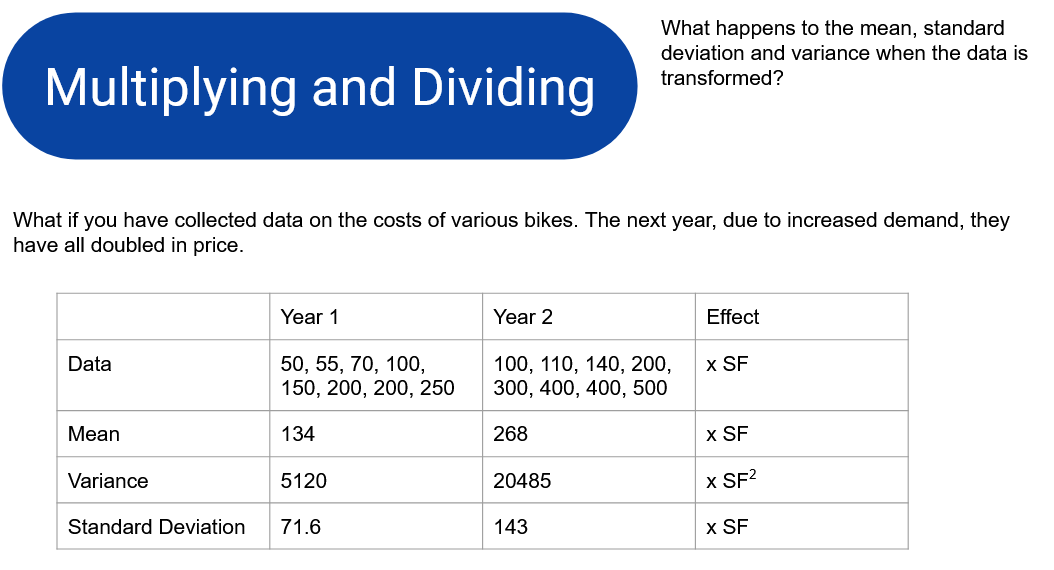
- Know what happens to the summary statistics when data is transformed.


Self Checking quiz
Practice your understanding on these quiz questions. Check your answers when you are done and read the worked solutions when you get stuck. If you find there are still some gaps in your understanding then go back to the videos above.
The following questions are based on IB exam style questions from past exams. You should print these off (from the document at the top) and try to do these questions under exam conditions. Then you can check your work with the video solution.
The table below shows the number of languages a class of 25 children speak
| No of languages | 1 | 2 | 3 | 4 | 5 |
| Frequency | 7 | p | 6 | 3 | 1 |
-
Find the value of p
(1)
-
Use your graphical display calculator to find
-
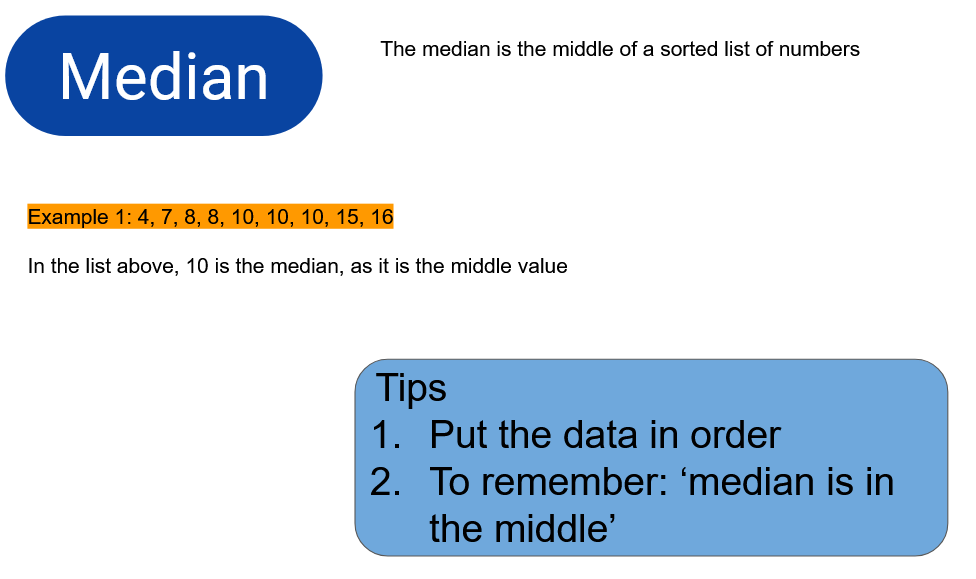
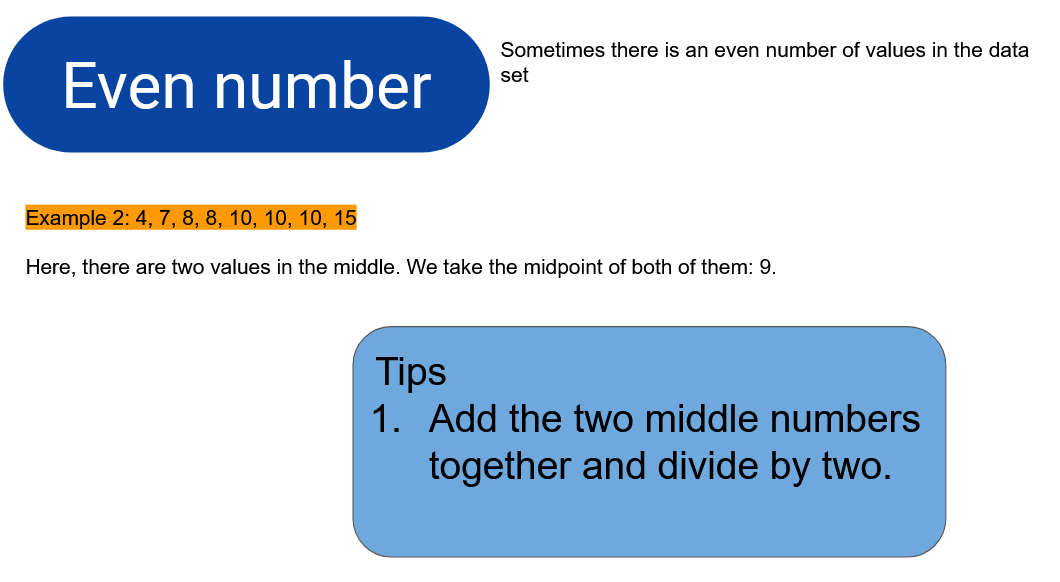
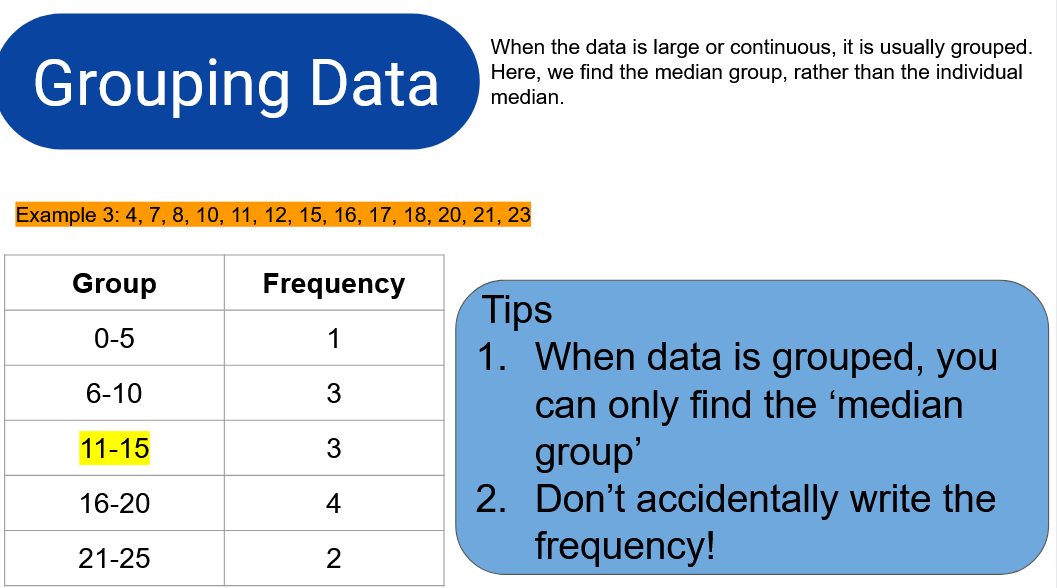
The median number of languages spoken
-
The mean number of languages spoken
-
The standard deviation of the number of languages spoken
-
(3)
-
Showing your working, identify any outliers in this data.
(2)
(6 marks)
Video solution
10 dogs were weighed and their results written down in kilograms. The following box and whisker plot was used to represent their weights.
a) Write down
(i) the median weight;
(ii) the 75th percentile weight;
(iii) the range of marks.
(4)
b) How many dogs weighed more than 39 kg?
(2)
The mean weight of the dogs was found to be 40.5kg, and the standard deviation 13.8. After being put on a strict exercise routine, all the dogs had lost 2kg the next time they were weighed.
c) What is the new mean and standard deviation of the dogs?
(2)
(Total 8 marks)
Video solution
How much of 4.3 Central tendency and Dispersion have you understood?
 Twitter
  Facebook
  LinkedIn