4.4 Bivariate data & Linear Correlation

Bivariate Data

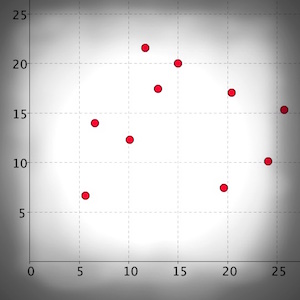
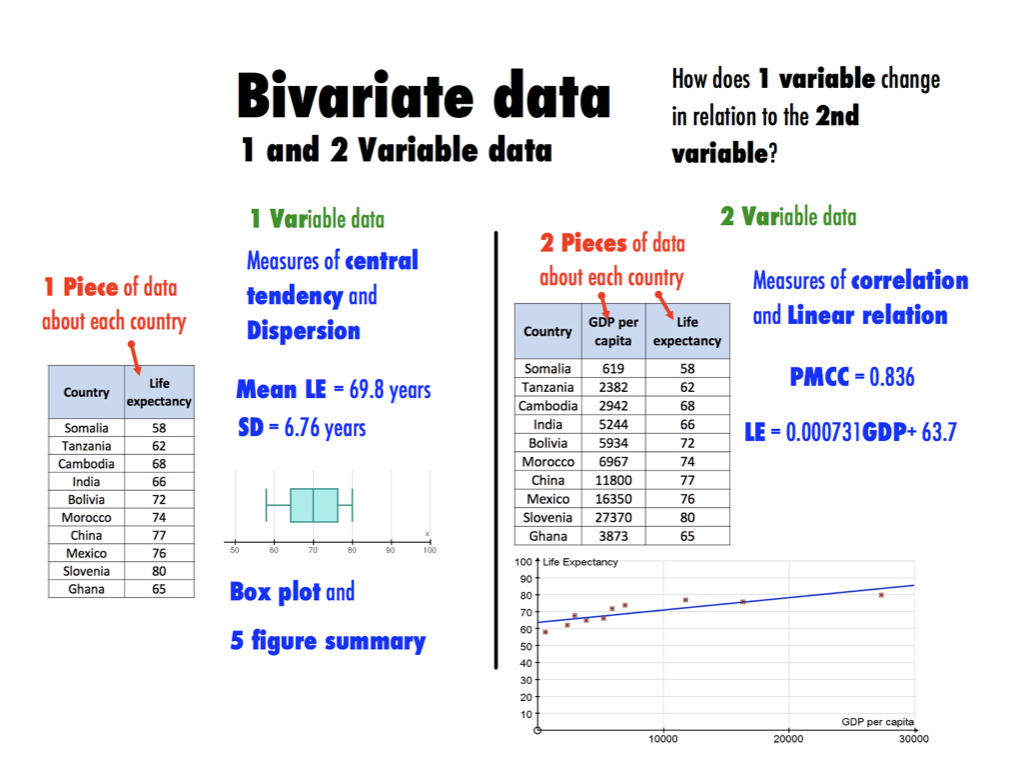
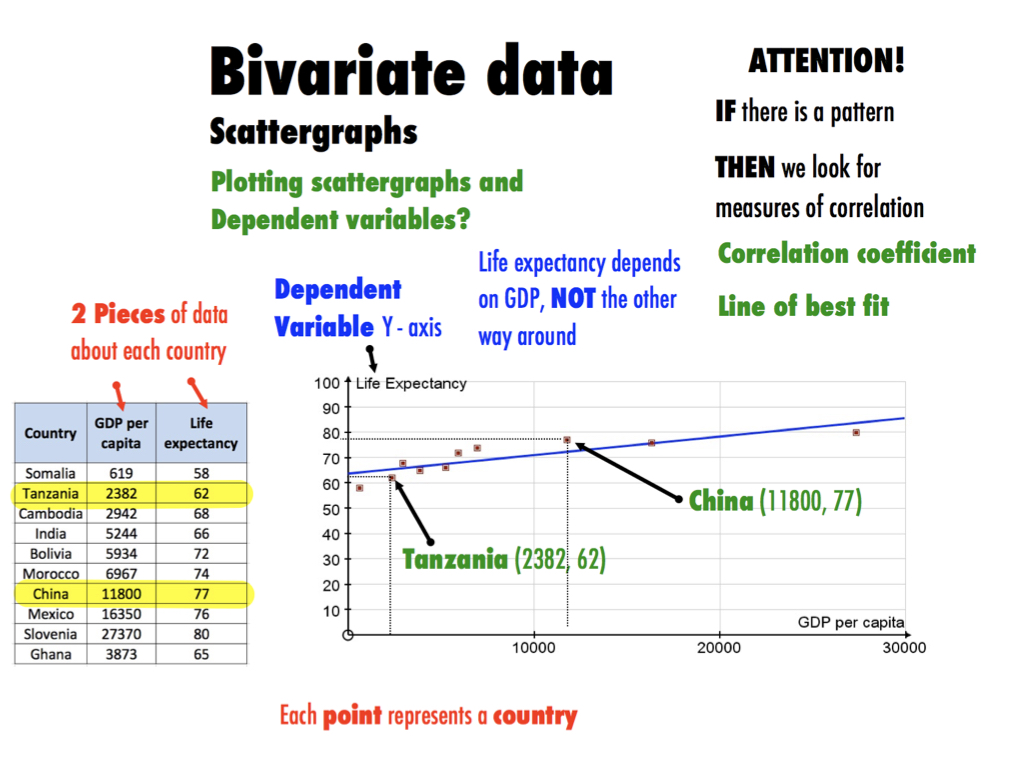
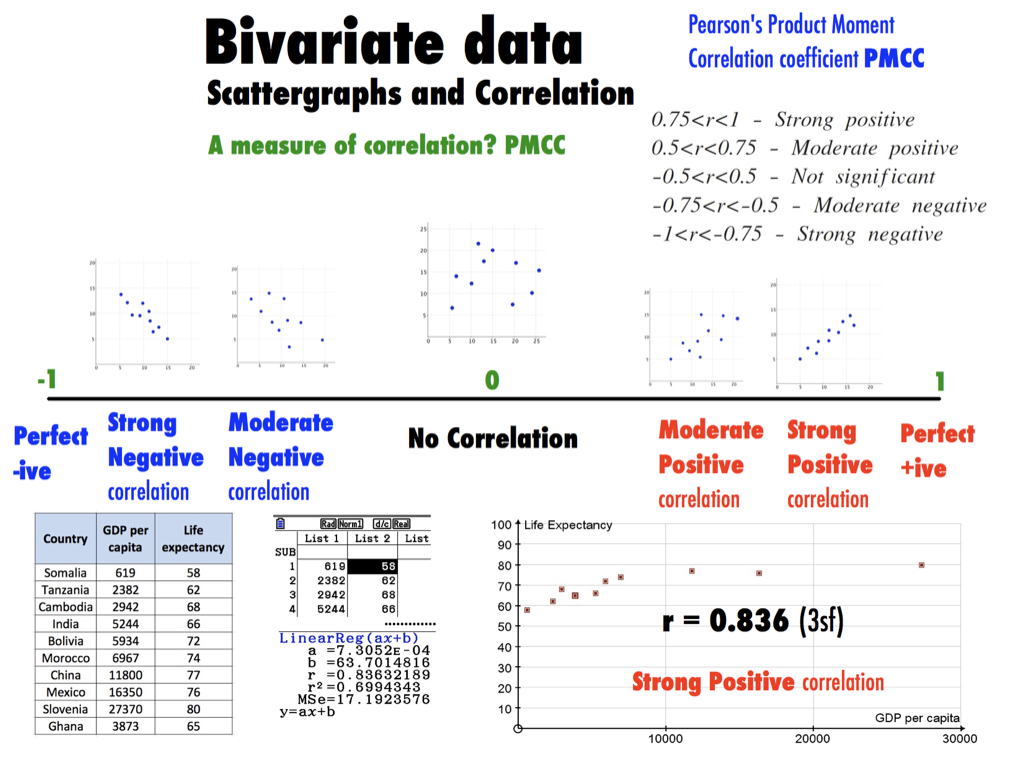
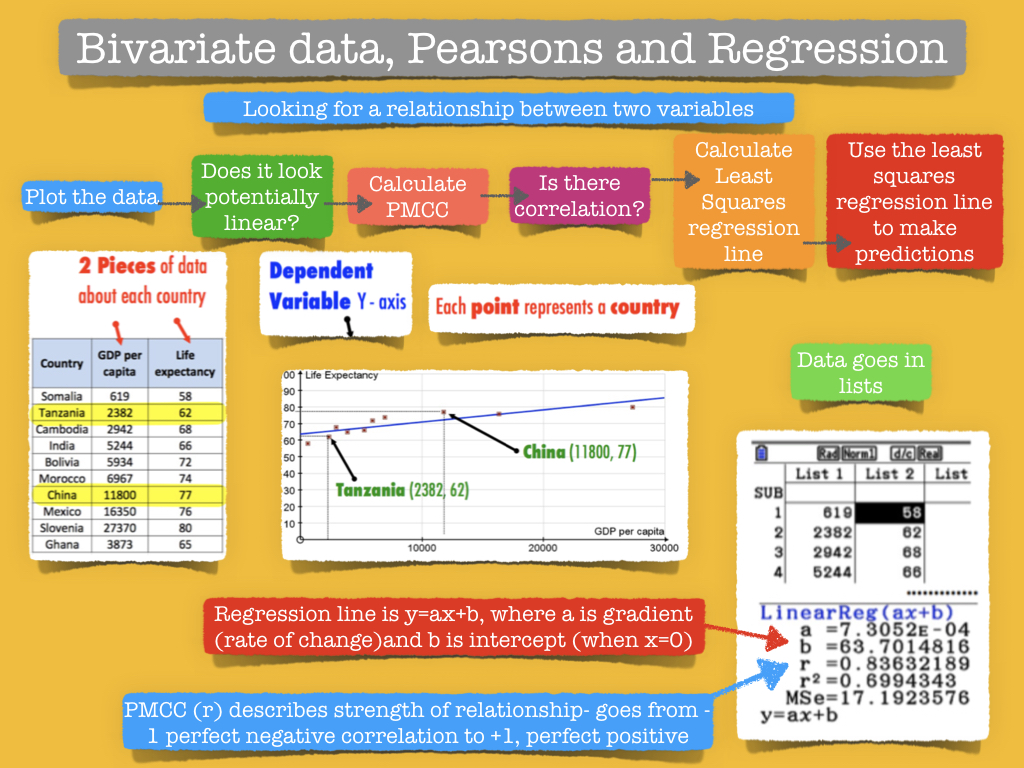
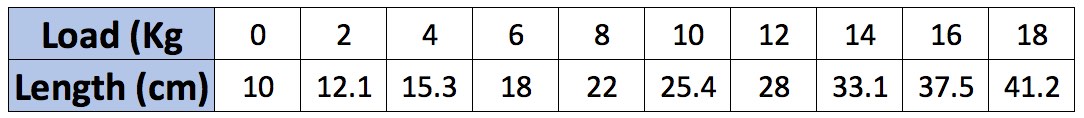
This topic is all about looking for relationships between variables. Does life expectancy depend on GDP? By collecting 2 variables about the things we survey we can use scatter graphs to represent the data and then look for correlation and models that we can then use for prediction.


Key Concepts

In this unit you should learn to…

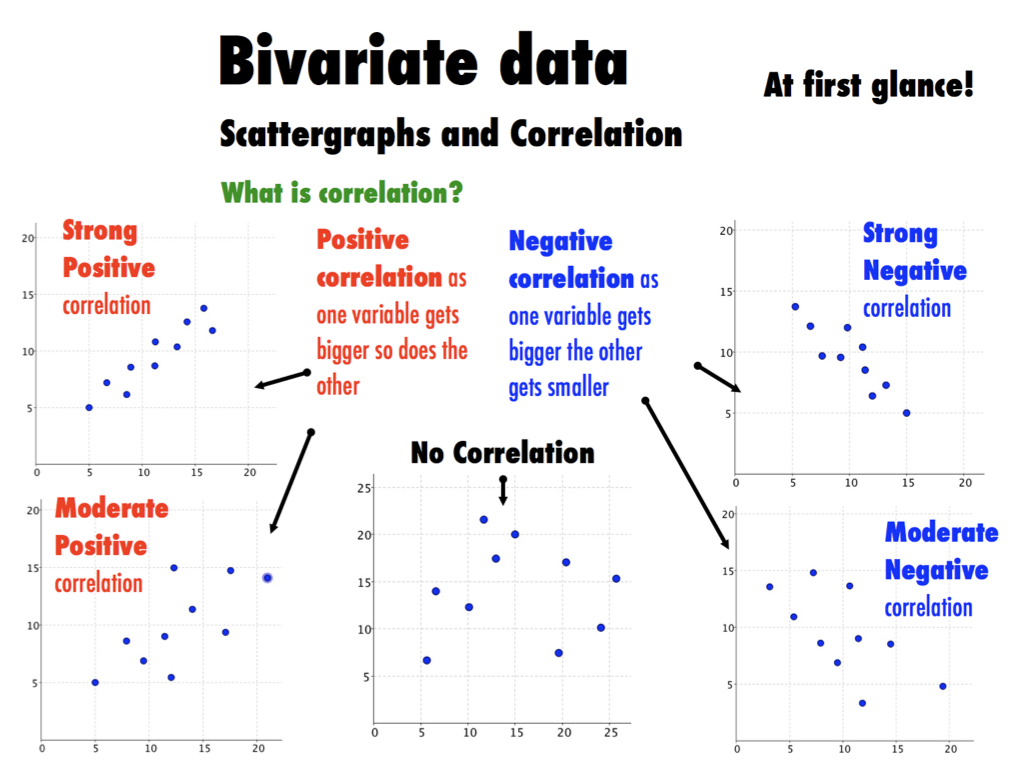
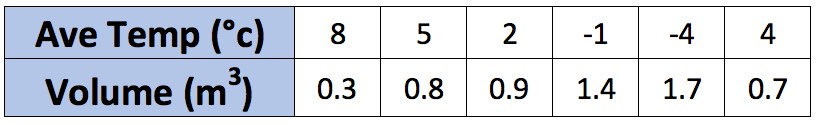
  • Collect, present and analyse 2 variable data looking for linear correlation

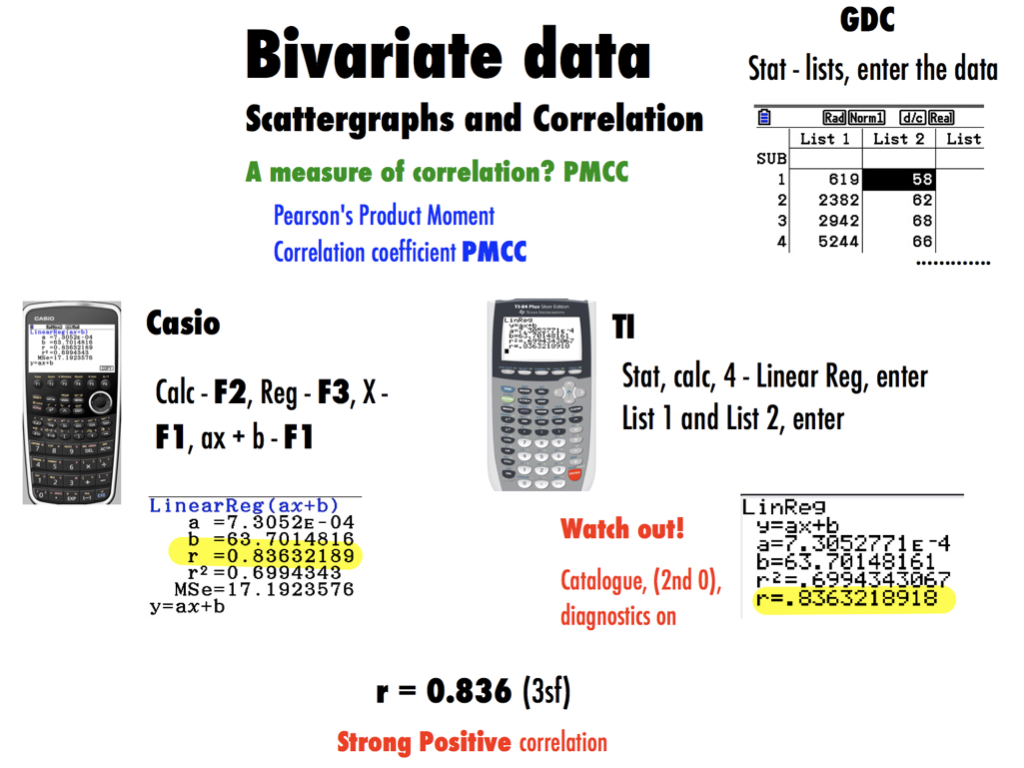
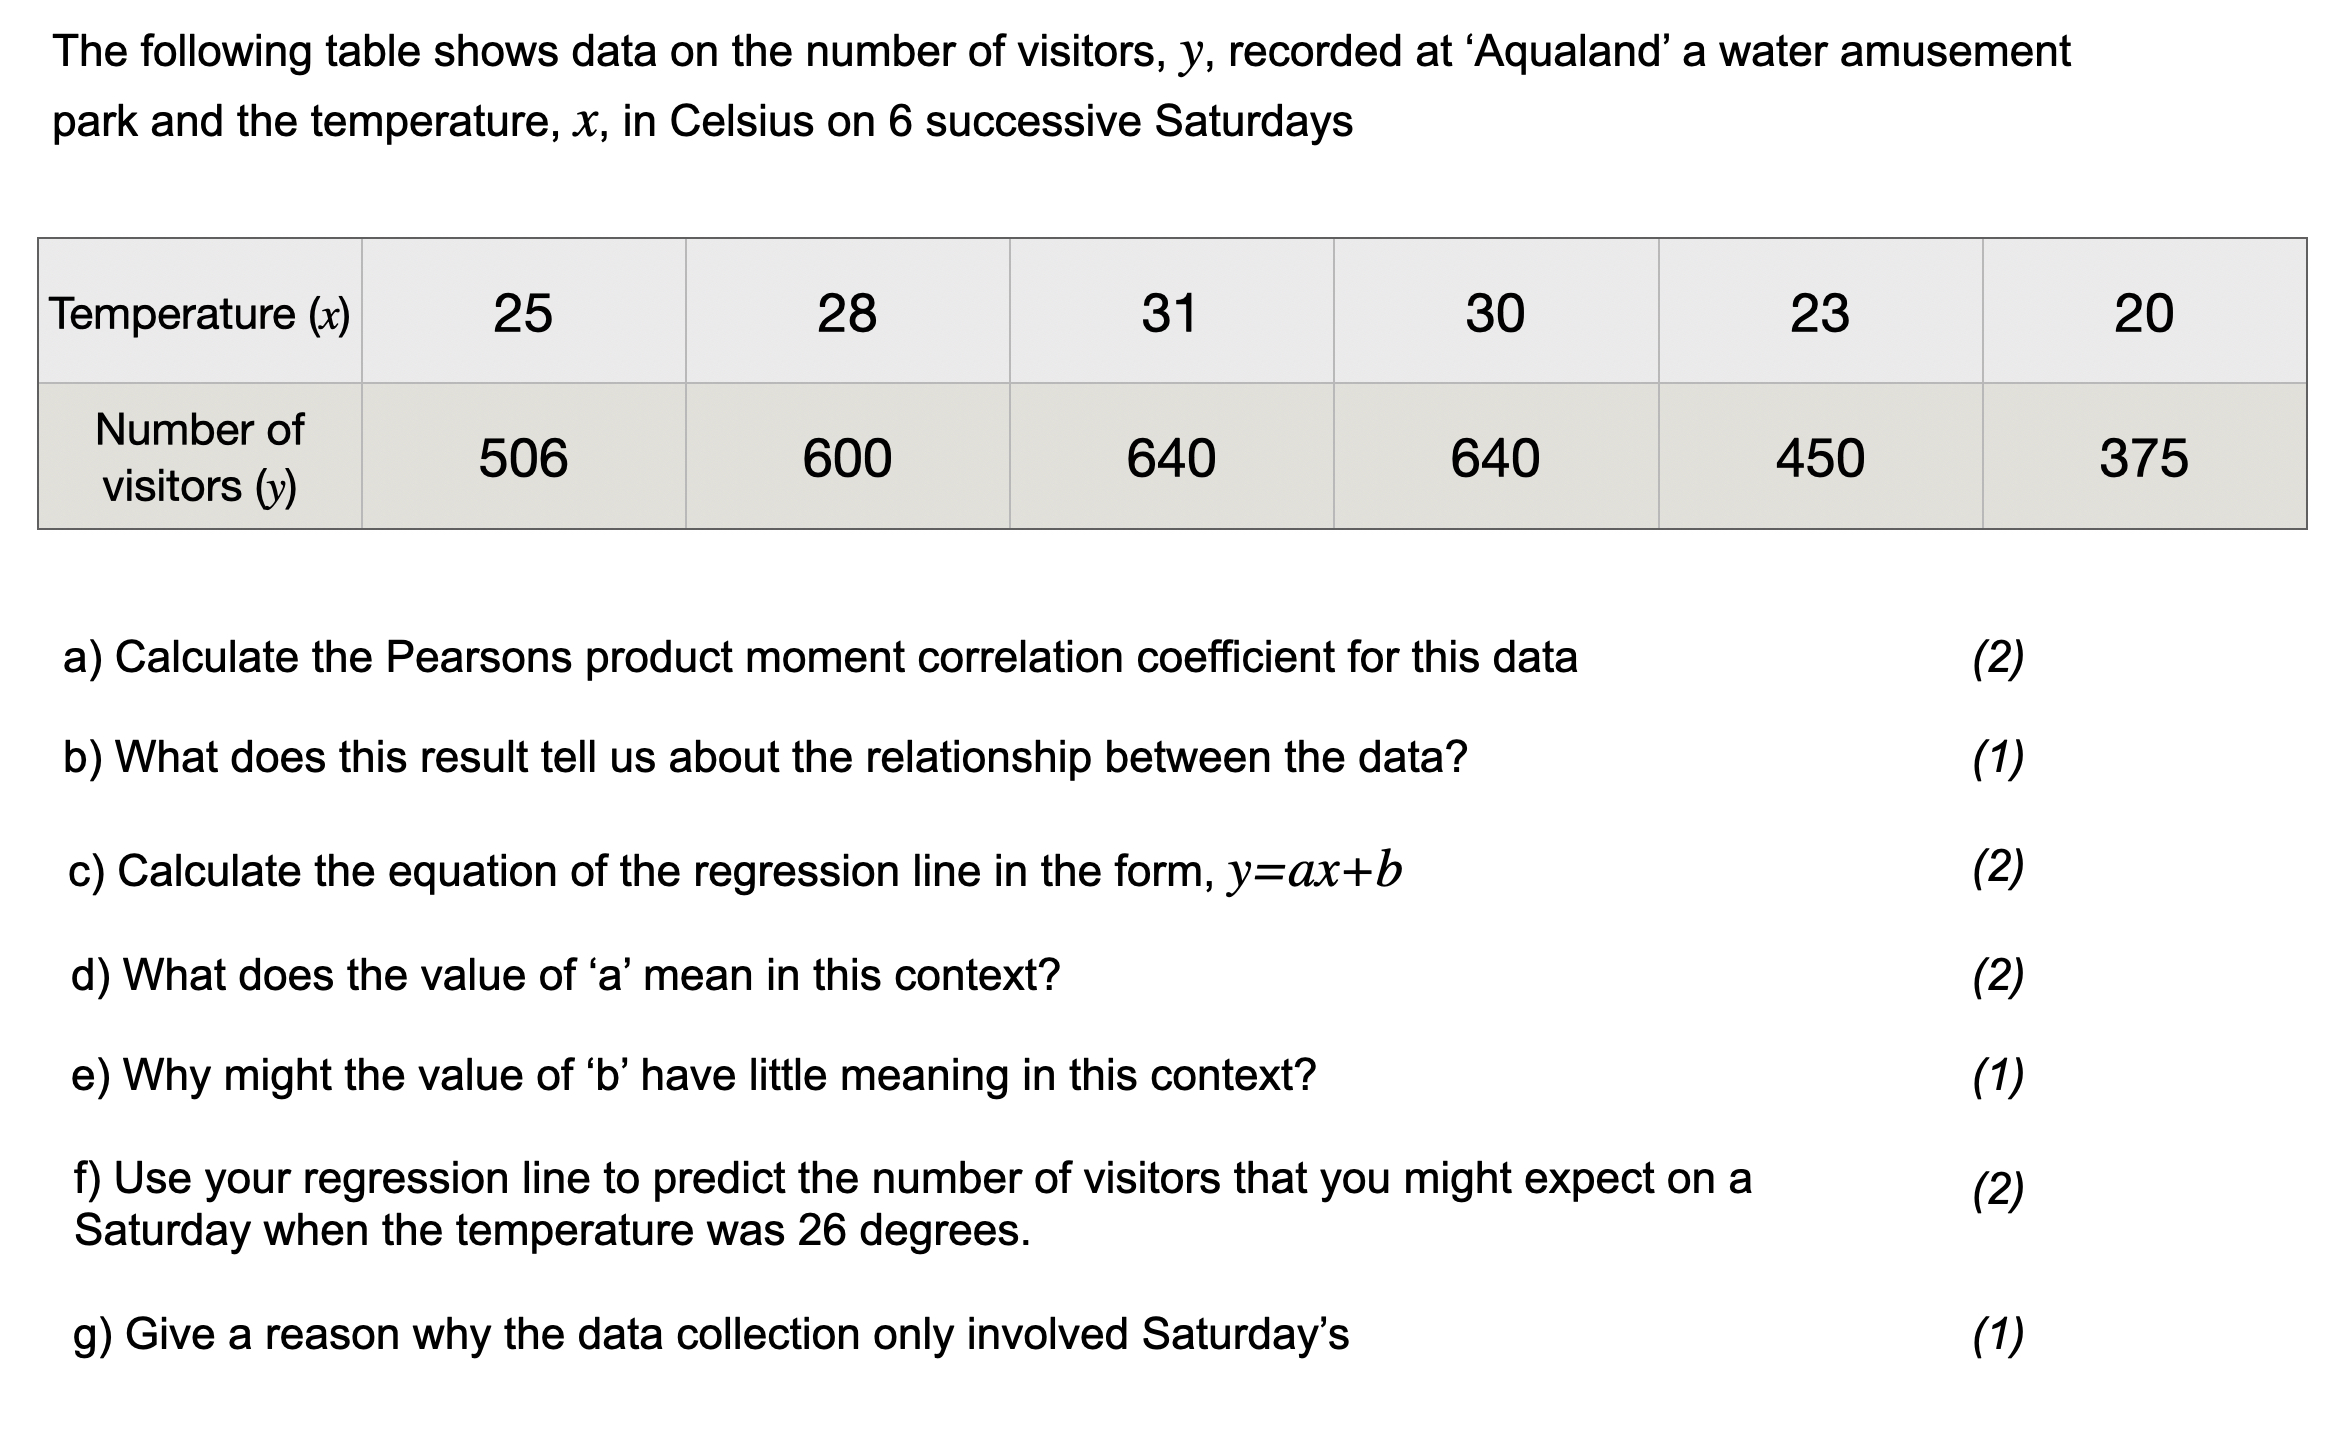
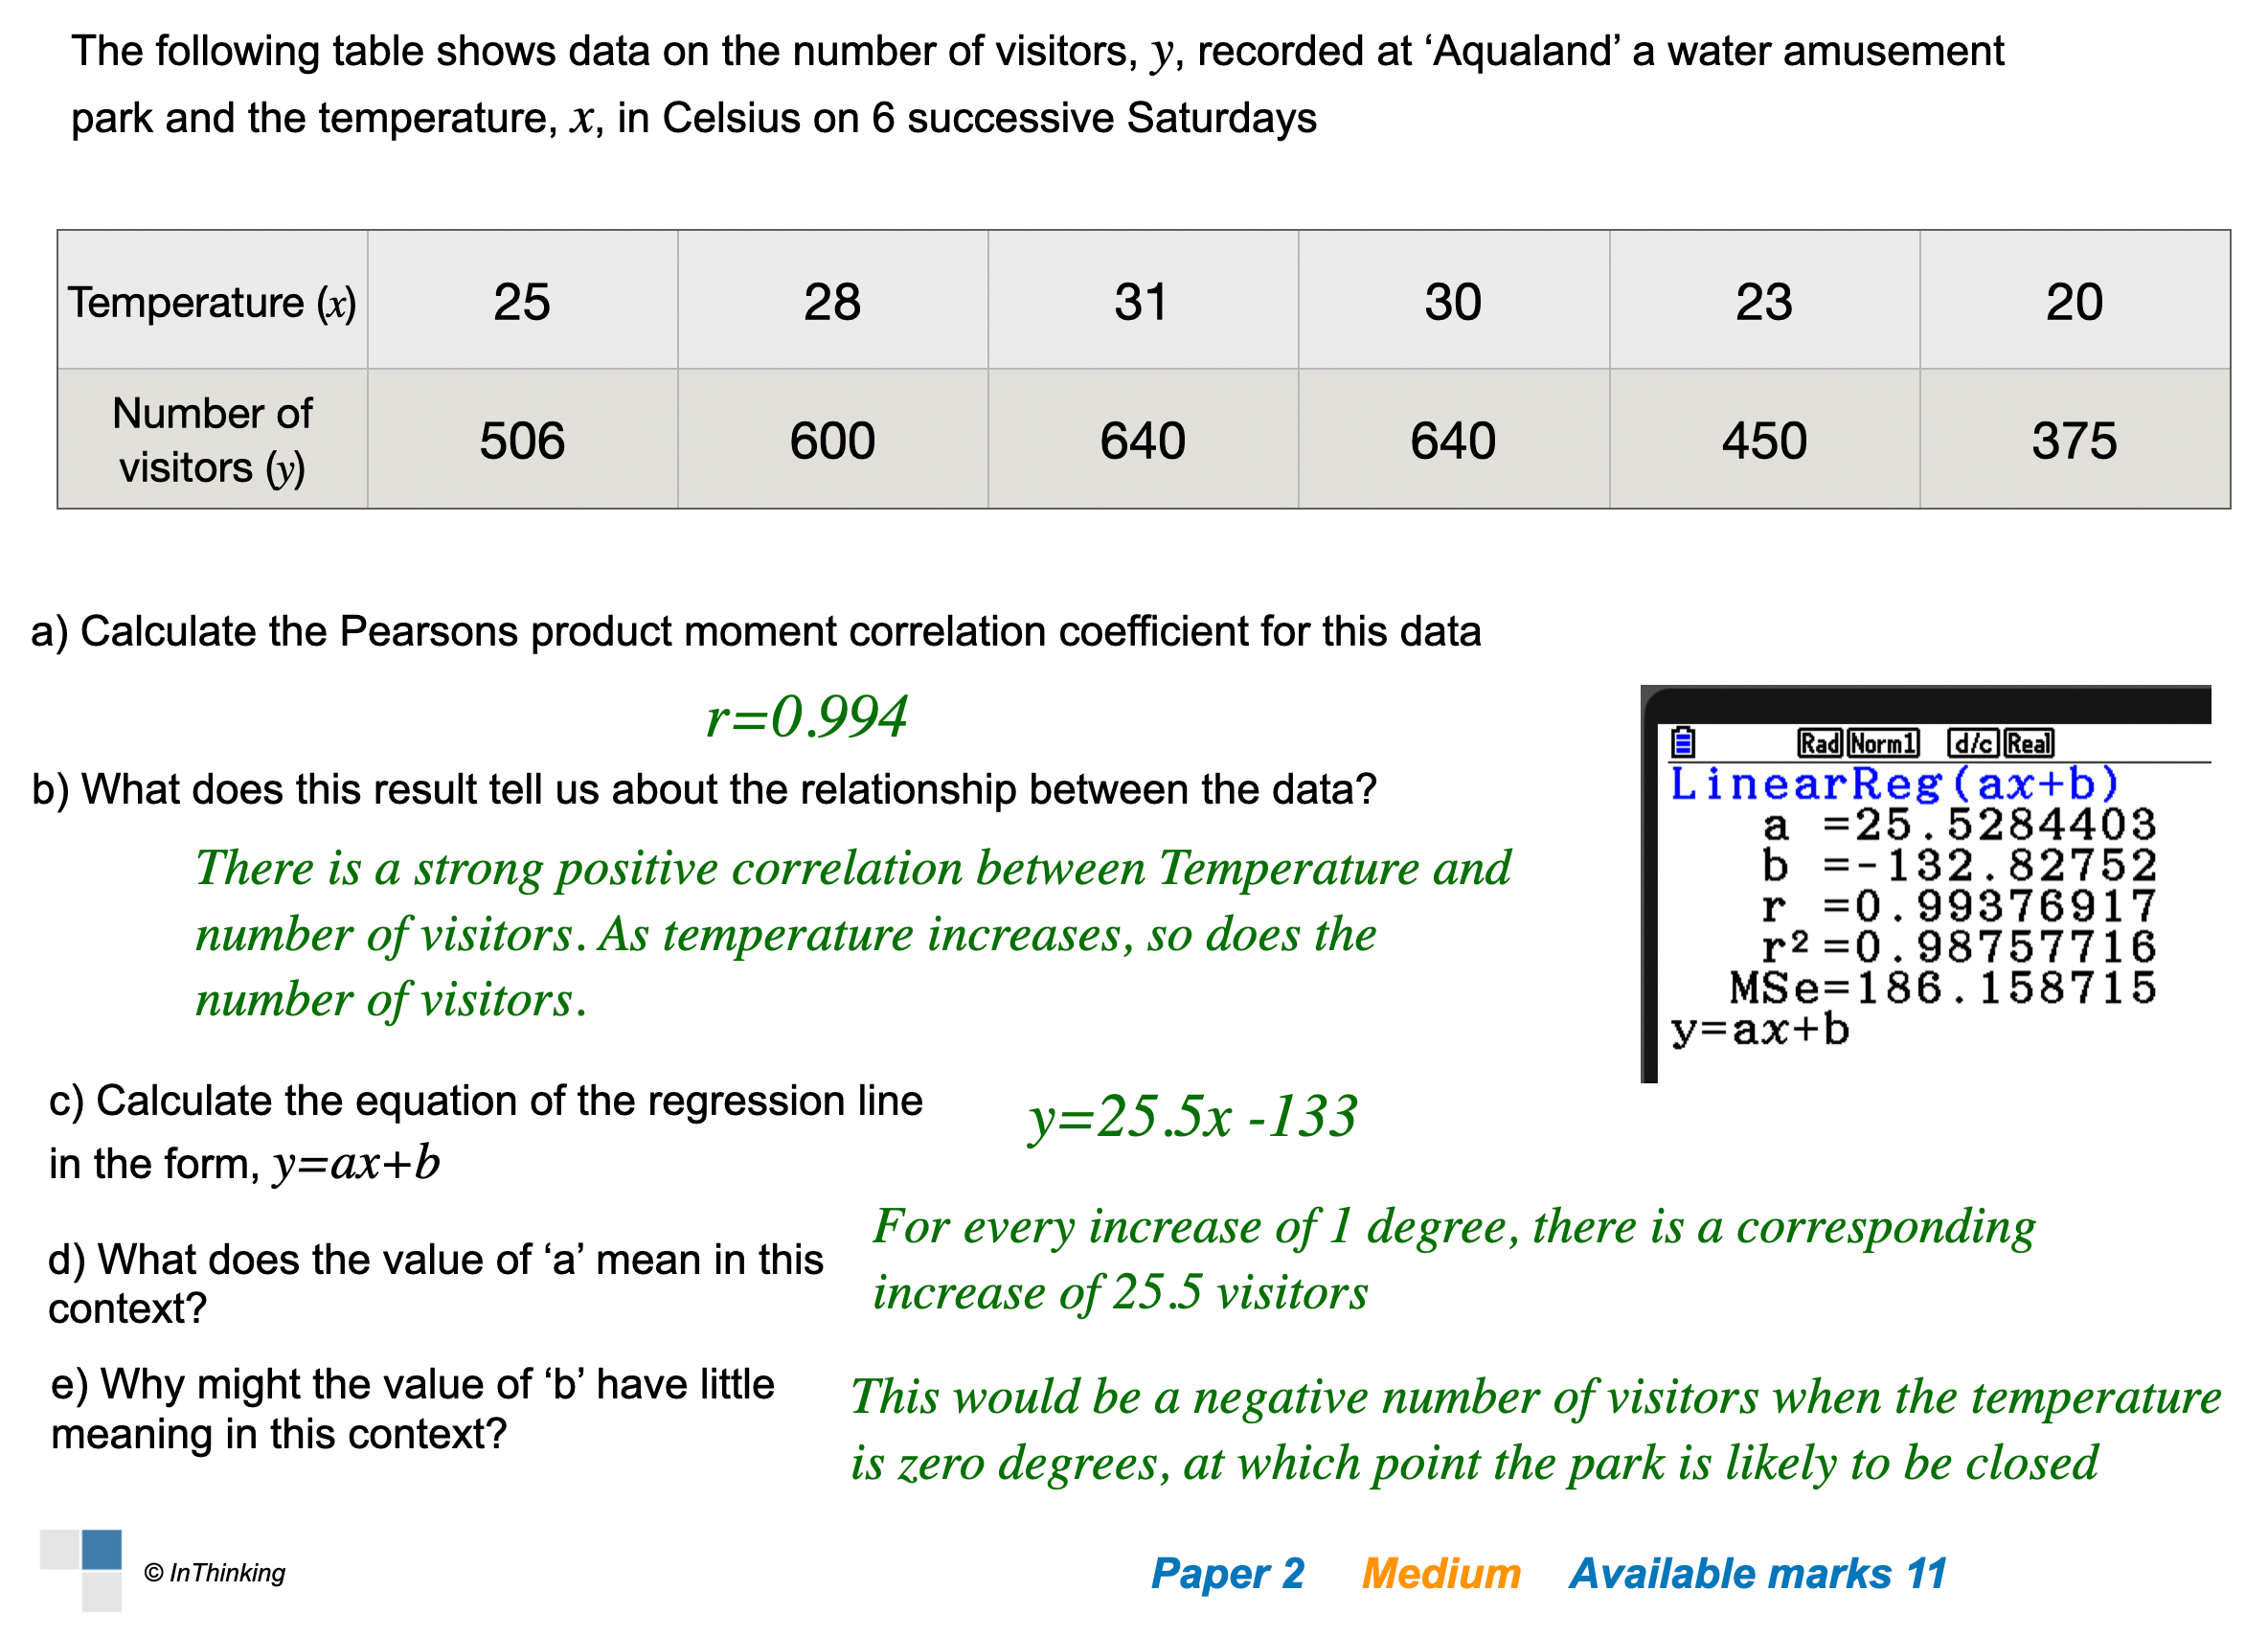
  • Calculate the Pearson's Product Moment Correlation Coefficient as a measure of degree of correlation

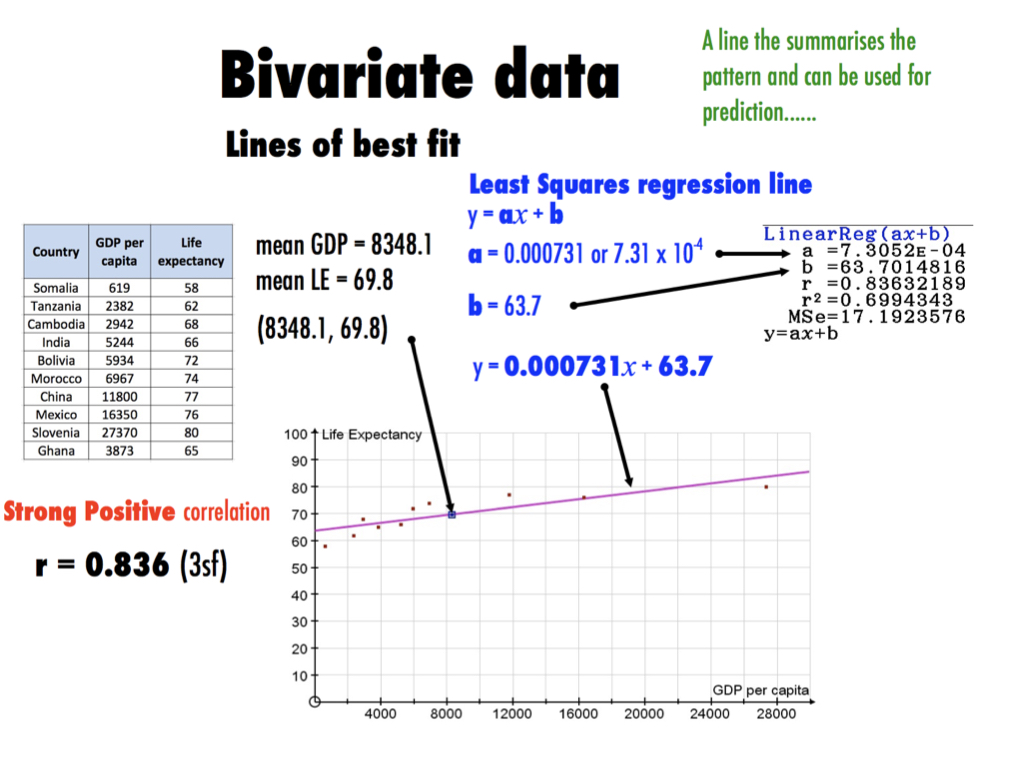
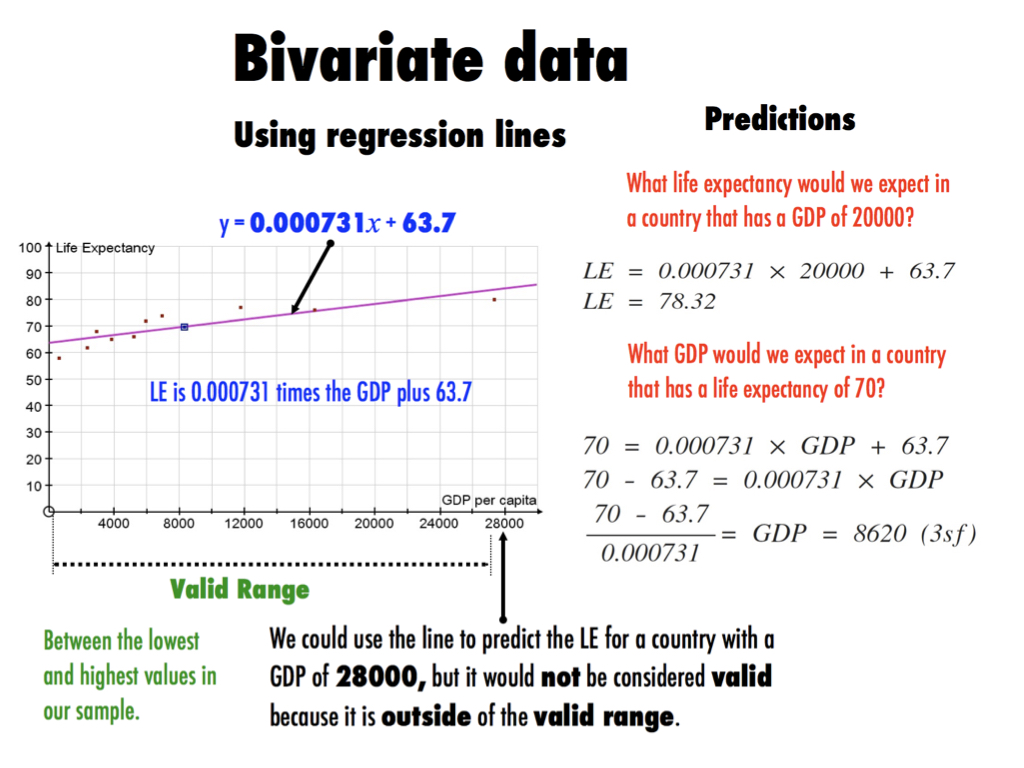
  • Calculate and use a regression line that models data that shows correlation.

Essentials

Slides Gallery

Use these slides to review the material and key points covered in the videos.

1. Bivariate data and Scatter diagrams

This video is an introduction to the concept of bivariate data and looking for relationships/correlation

2. Scattergraphs

This is about plotting and interpreting these diagrams

3. Correlation 

This video is about judging correlation

4. Product moment correlation coefficient

This is about calculating this key measurement of correlation

5. Lines of best fit

This is about how lines of best fit become calculated 'Least squares regression lines' that are accurate measures of the pattern.

6. Making predictions

If we have correlation, and we have calculated a regression line, we can use it to make predictions.

Summary

Revision Card - Review this condensed 'key point' revision card to help you check and keep ideas fresh in your mind.

Test yourself

Self Checking Quiz

Practice your understanding on these quiz questions. Check your answers when you are done and read the hints where you got stuck. If you find there are still some gaps in your understanding then go back to the videos and slides above.

Exam Style Questions

The following questions are based on IB exam style questions from past exams. You should print these off (from the document at the top) and try to do these questions under exam conditions. Then you can check your work with the video solution.

Question 1

Video solution

Question 2

Video solution

Question 3

Video solution

Question 4

Mikel believes there is a linear relationship between time spent studying and performance in an IB exam.To test this, he collected data on ten of his classmates. He recorded the time spent studying, x, alongside the percentage they received in their most recent exam, y. 

The following table shows the data he found. 

Hours studying, x.        

4     

 5  

4    

3   

7   

2   

7   

9   

10  

11

Percentage Score, y

58

60 

43

40

65

35

70

75

75

80


a. Why does Pearson’s Product Moment Correlation Coefficient appear to be valid for this data?

b. Find the value of Pearson’s Product Moment Correlation Coefficient, r. 

c. Comment on the strength of the correlation

Mikel decides to study for 8 hours for the test. 

d. By using the equation of the regression line, what score could he expect to get?


Video Solution


MY PROGRESS

How much of 4.4 Bivariate data & Linear Correlation have you understood?