
 A linear graph refers to any straight line relationship.
Key Concepts
Equation
A straight line can be described by the following equation:
\(y = mx+c\)
- \(m\) is the gradient
- \(c\) is the y-intercept
Practical skills
- If there are error bars drawn on a graph from an experiment, then it must be possible to place your ruler inside all of the error bars at once for the graph to be linear.
- A proportional graph refers to the special case where the line is straight and passes through the origin (0,0). Experiments can be used to verify proportional relationships such as Ohm's Law and Hooke's Law.
Tutorial
This video shows the effects of changing \(m\) and \(c\) on the appearance of the line.
Use quizzes to practise application of theory.
START QUIZ!
What is the gradient of the following graph
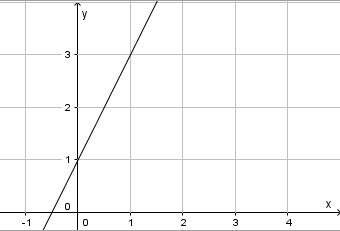
change in y/change in x = 2/1
What is the equation of the following line
Y = (gradient) + (y intercept)
The gradient of the line in the following graph is:
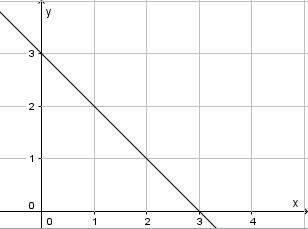
change in y is negative so gradient = -3/3
The following line can be represented by the equation y = mx + c
What is the value of c?
c is the y intercept
MY PROGRESS
How much of Linear graphs have you understood?
 Twitter
  Facebook
  LinkedIn