
 An error is the difference between the value you determine and the true value. Given that we collect data in experiments, and that our measuring instruments are not perfectly sensitive, there will always be an uncertainty in our value.
Key Concepts
A systematic error causes all measurements to be offset by exactly the same amount. This has the effect of changing the y-axis on a linear graph, for example:
- a non-zeroed ruler when measuring length
- failing to subtract the mass of the measuring cylinder when finding the density of a liquid
A random error is usually caused by the experimenter's interaction with the equipment and could increase or decrease the measurement. Provided that a large number of data points have been collected or that repeats have been done, the overall effect of a random error should increase the size of the error bars, but not the final gradient or intercept. For example:
- deciding when a pendulum passes a fiducial marker
- marking the centre of a light ray from a reflecting surface
Absolute uncertainties can be combined easily for quantities that are added. For example, if Alice and Ben are in charge of timing the first 10 m and last 10 m of a race, you would add together the times and the uncertainties:
\(4.6 \pm 0.3\) s added to \(4.2 \pm 0.2\) s is \(8.8 \pm 0.5\) s
The same applies for subtraction; add the uncertainties. As a rule of thumb, the uncertainty should always increase with more data being combined.
NB: If quantities are multiplied or divided, absolute uncertainties cannot be combined. Instead, the fractional uncertainties are added:
If \(a=bc\) or \(a={ b \over c}\), \({\Delta a \over a} = {\Delta b \over b} +{\Delta c \over c} \)
You can then convert back into an absolute uncertainty by multiplying by the value (in this case, \(a\)).
A trick with powers is to realise that, for example, \(a^3 = a \times a \times a\). It is then quite straightforward to spot the following:
\({\Delta a^3 \over a^3}={\Delta a \over a}+{\Delta a \over a}+{\Delta a \over a} = 3{\Delta a \over a}\)
In general:
\({\Delta a^n \over a^n}=n{\Delta a \over a}\)
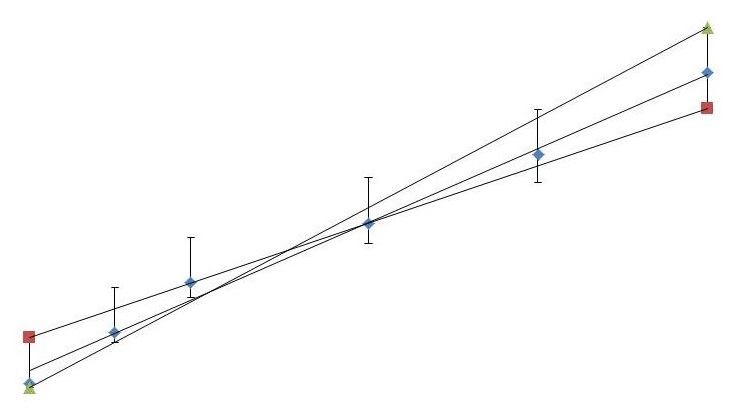
 In your Internal Assessment or Extended Essay you are likely to want to know the uncertainty in your gradient or intercept (for a linear relationship). Simply draw the maximum and minimum gradients of the line based on your error bars and find the gradient or intercept of each. The largest deviation from the best fit line will provide a good estimate of the uncertainty.
The goal is for our uncertainty to encompass the true value. This makes an experiment accurate. For example, finding \(g=8 \pm2 \) ms-2 is accurate, even though it is much less precise than finding \(g=9.79 \pm 0.01\)ms-2 (which is inaccurate).
How much of Error and uncertainty have you understood?
 Twitter
  Facebook
  LinkedIn