
 There are a few rules to follow when presenting data...
Key Concepts
Use the headings of a table to include the symbol, units, order of magnitude and uncertainty of data collected.
\(t/\)s
This indicates that you are recording values of time with negligible uncertainty (perhaps because you have recorded the experiment) in seconds.
\(s \pm 0.1 /10^{-3}\)m
This indicates that you are recording values of displacement, probably in mm (converted into metres) and with an uncertainty of \(0.1 \times 10^{-3}\)m.
Down a column we would expect to see a constant number of decimal places (unless the sensitivity of your measuring device changes midway through the experiment). When calculating the latter values in a row, we would expect a consistent number of significant figures.
Different types of graph or chart are appropriate for different types of data.
Bar charts are for frequencies (quantities) of categoric data (data which is organised using words) such as:
- The number of people born on certain days of the week
- The extent to which I enjoy different types of sandwich
The height of the bar represents the frequency. We would not expect to see an overall trend with a bar chart, as the categories could reasonably be in any order.
Pie charts are used to show ratios (such as a percentage) of a whole. 360o of the pie represents 100%.
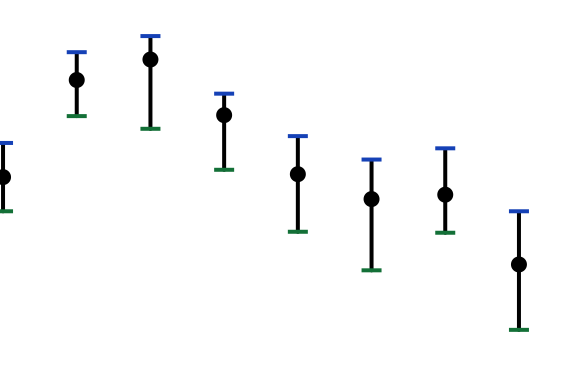
Most often in physics we are interested in the change of two variables. Therefore, we plot scatter graphs with data points and try to fit a linear or non-linear relationship:
The uncertainty in the data should be shown using error bars.
How much of Presenting data have you understood?
 Twitter
  Facebook
  LinkedIn