
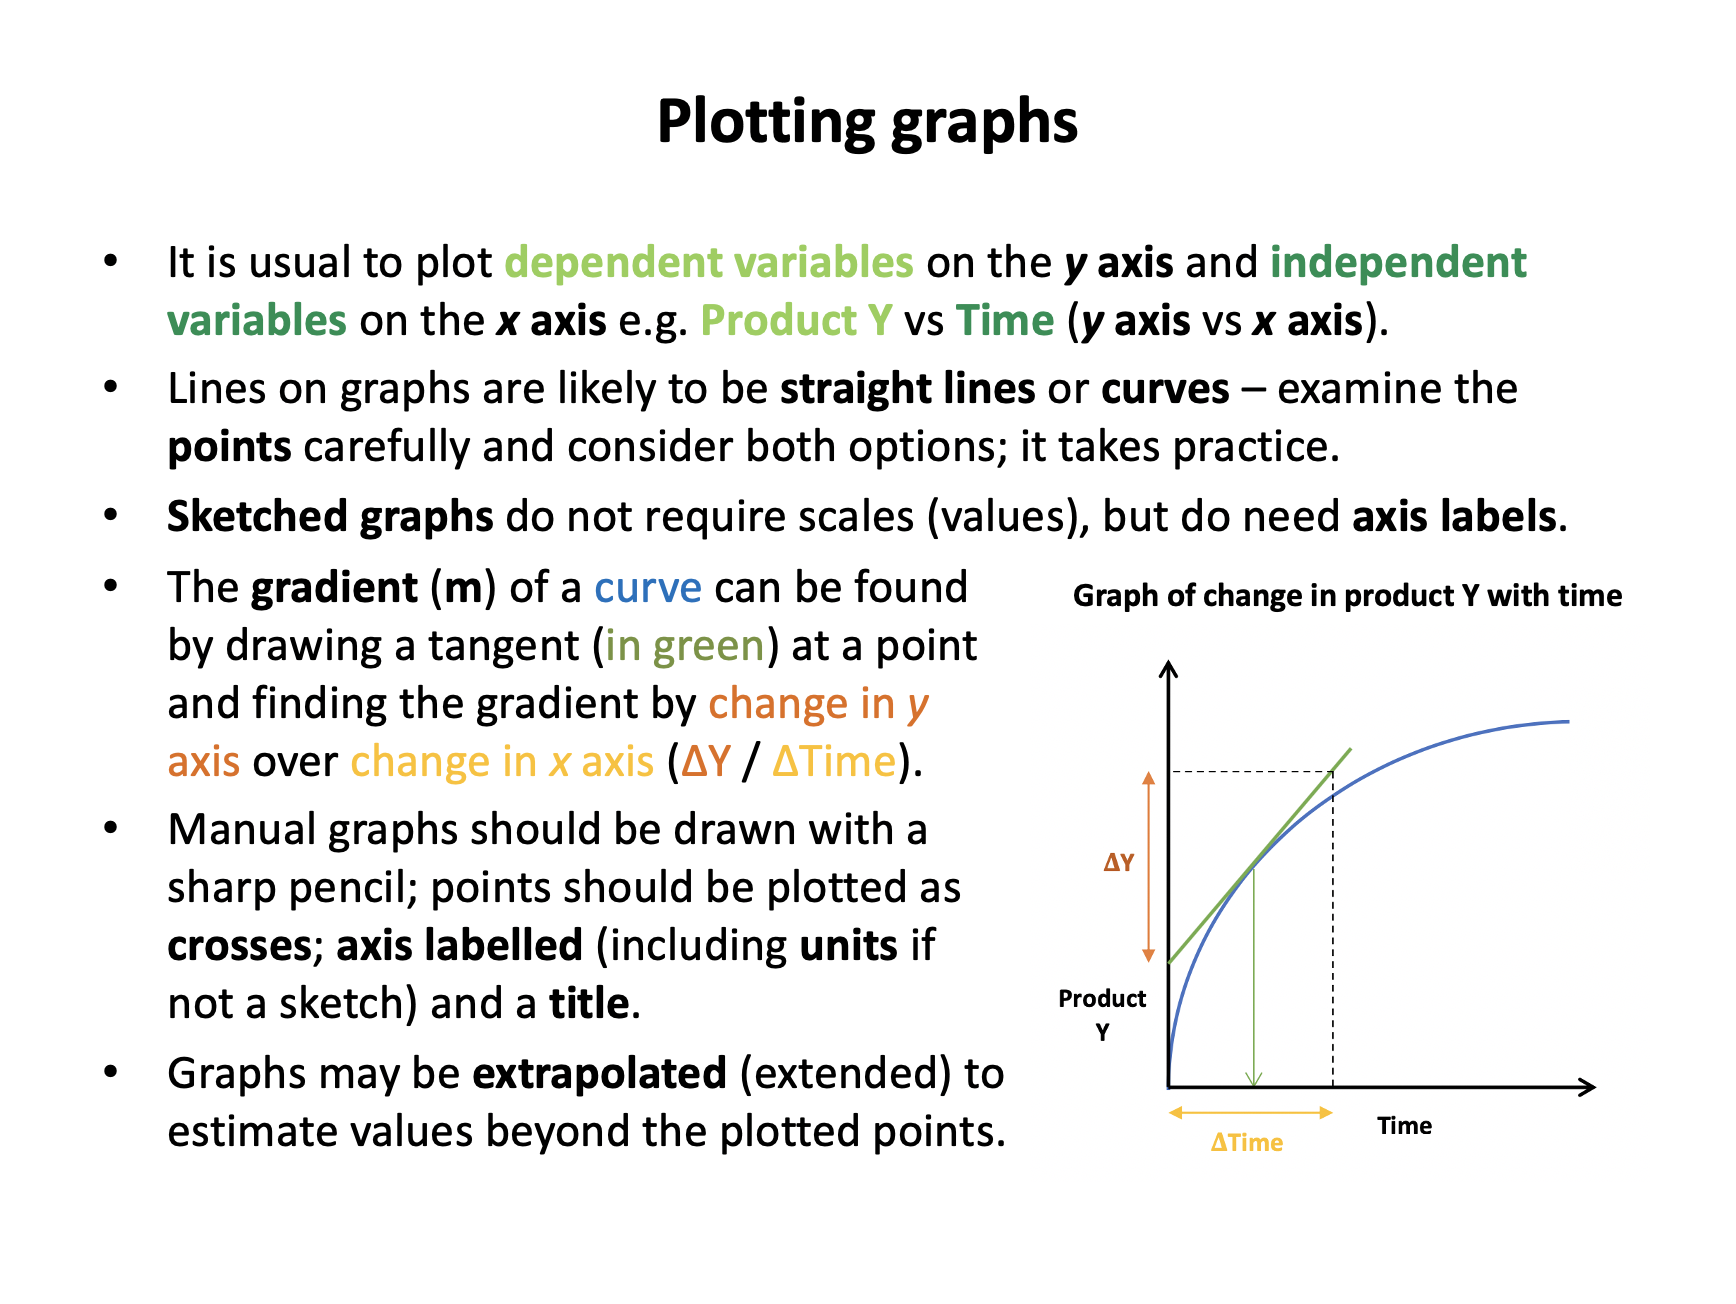
 The content that is here is mostly useful for internal assessment, and not assessed a great deal in examinations. So you do not have to learn all this for the exams! There is an extraordinary amount of vocabulary in this section of the course, but once you have got to grips with it all, the application of it is simpler than it at first appears. Use the flashcards to learn the terms and use the quiz to give you an idea of how the content is likely to be applied to questions.
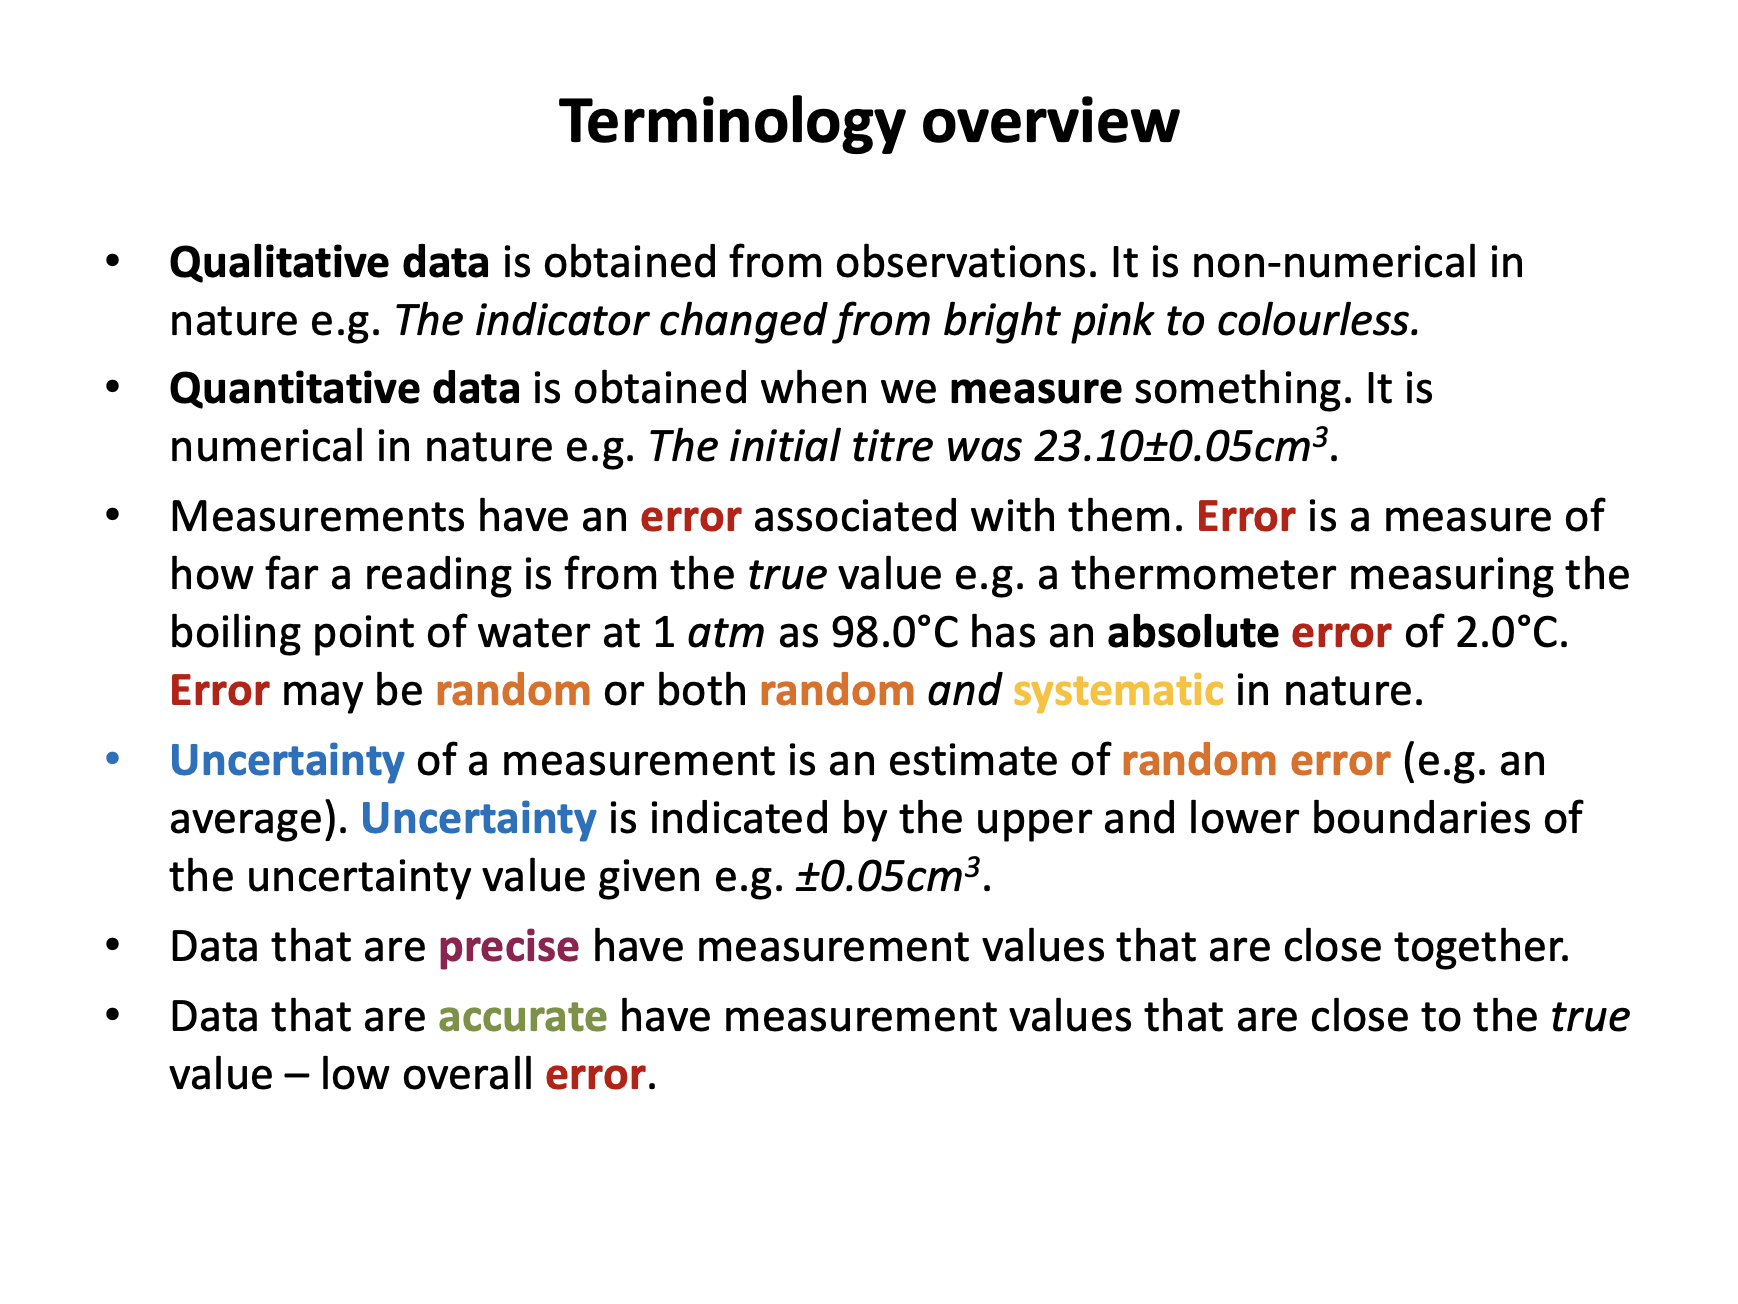
Ensure you are confident using the terms below and learn the asterisked* definitions
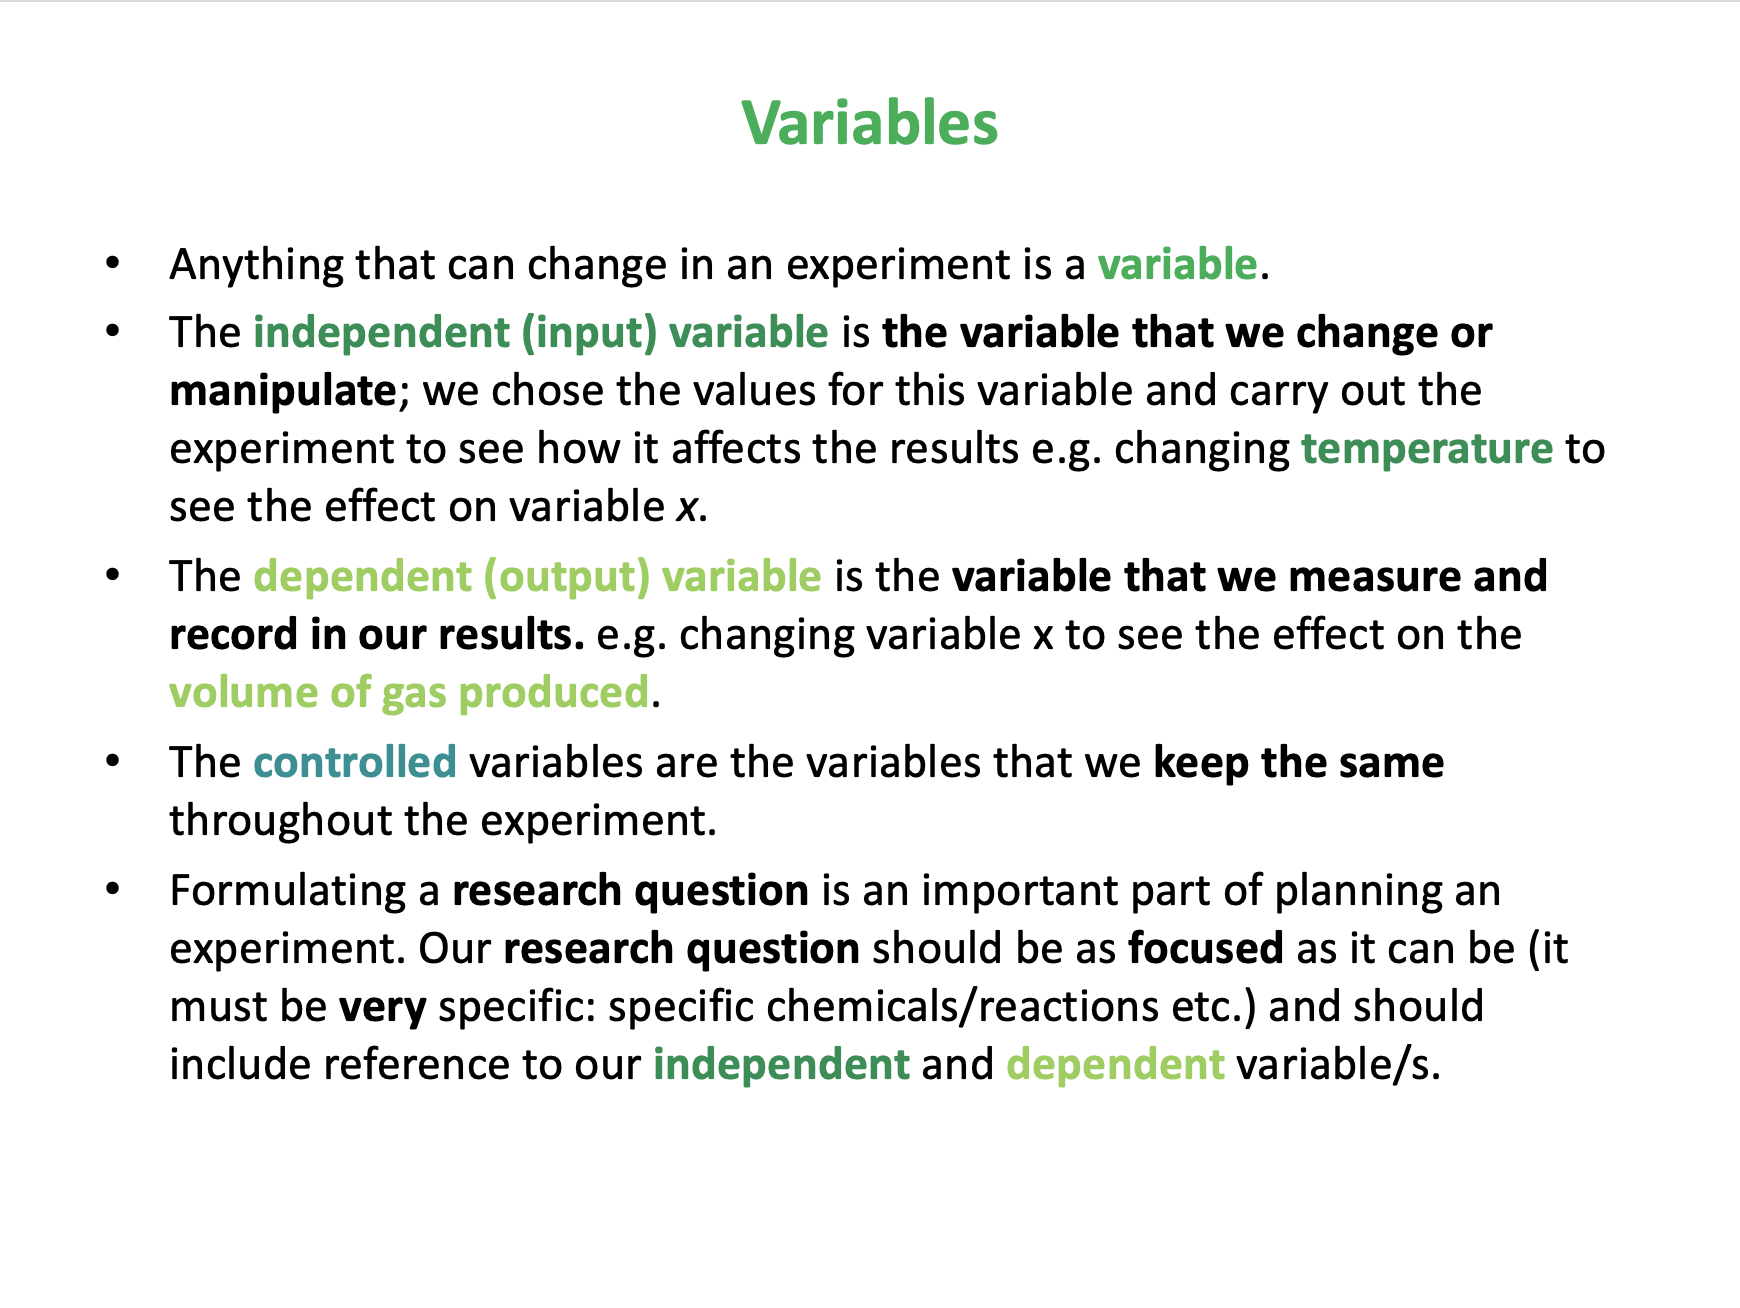
Accuracy, Precision, Error, Random error, Systematic error, Uncertainty, Absolute uncertainty, Percentage uncertainty, Dependent variable, Independent variable, Controlled variable, Extrapolation
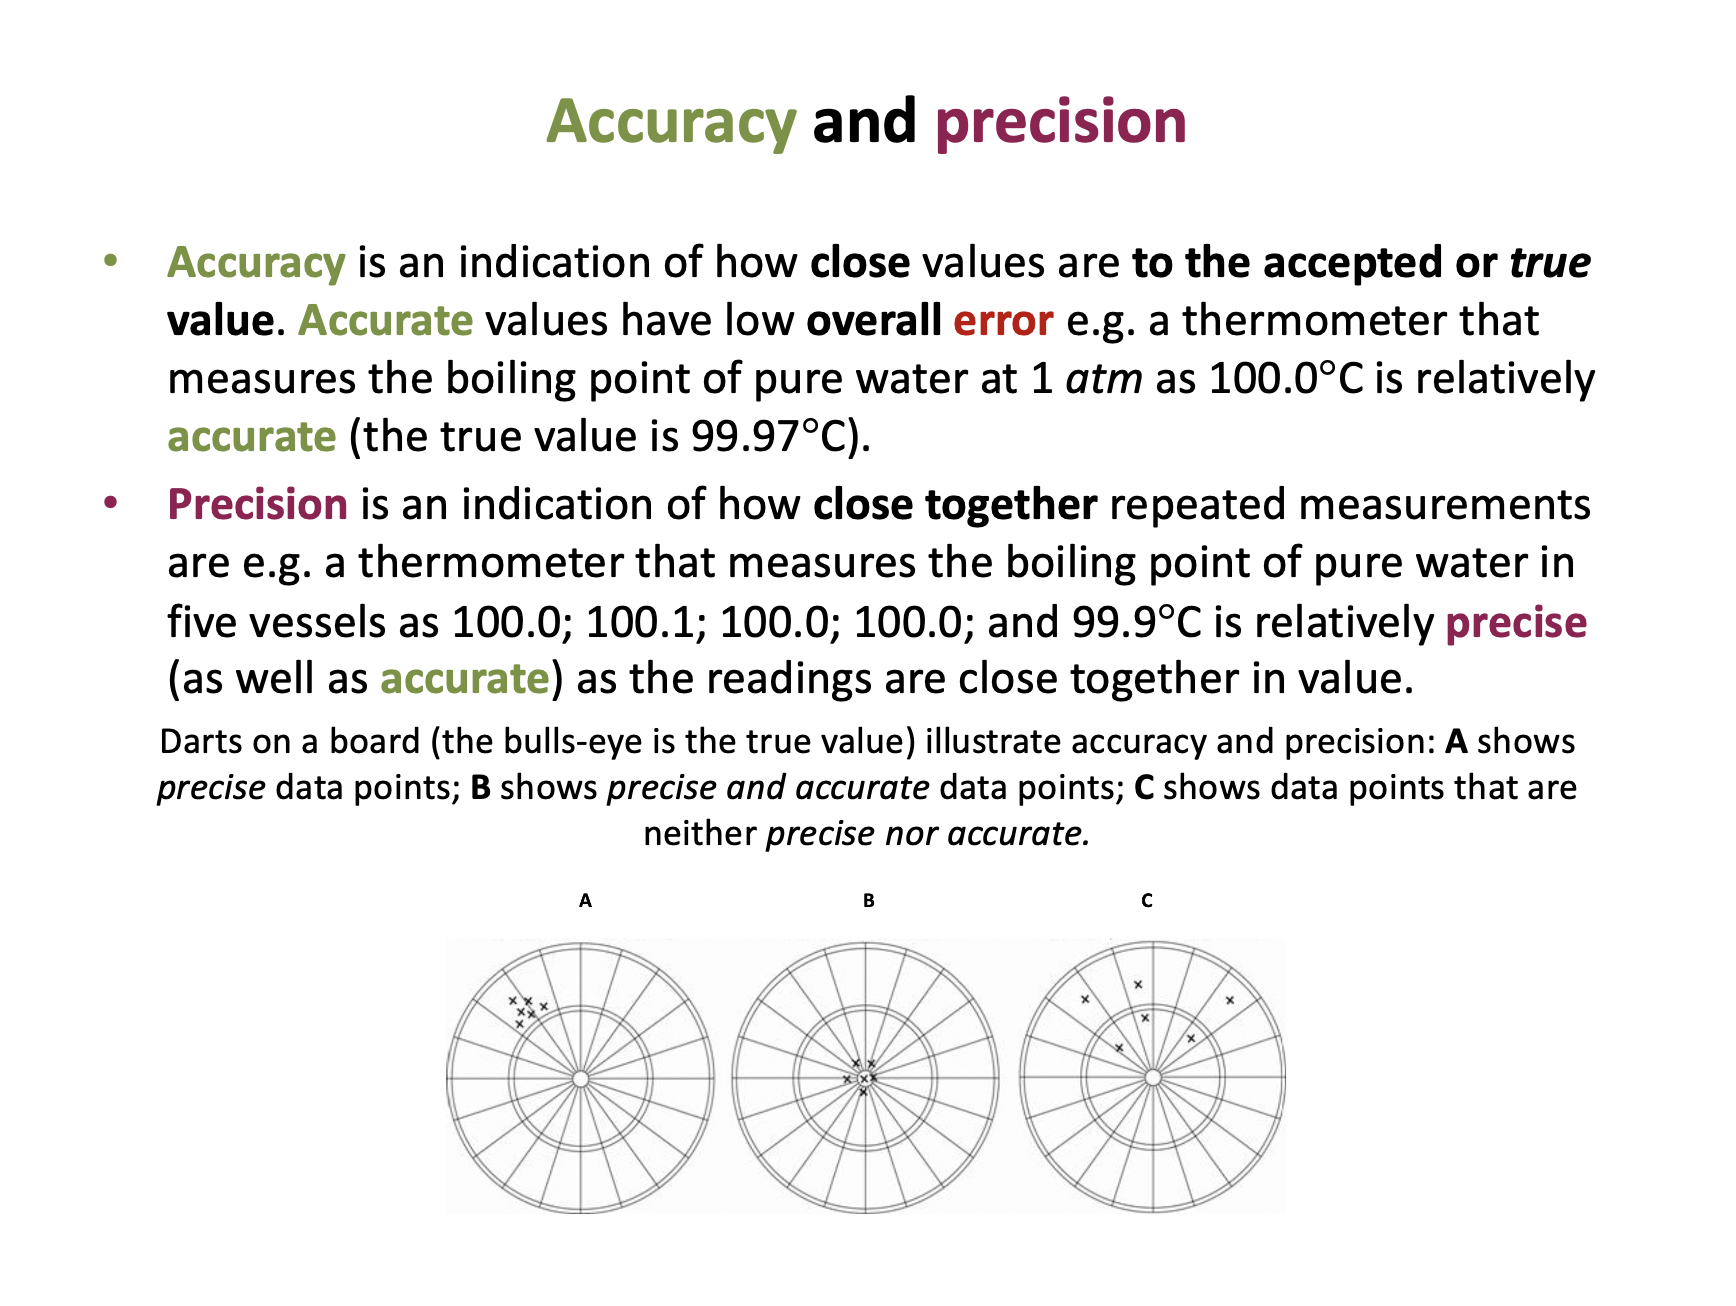


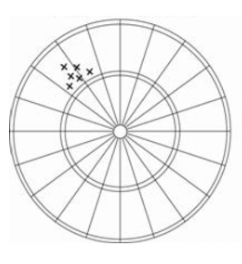
Sets of darts in a dartboard can be used to illustrate accuracy and precision, where the bullseye is the true value:
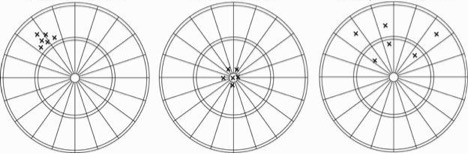 | ||
| A | B | C |
C shows data points that are not close together (precise) nor close to the true value (accurate).
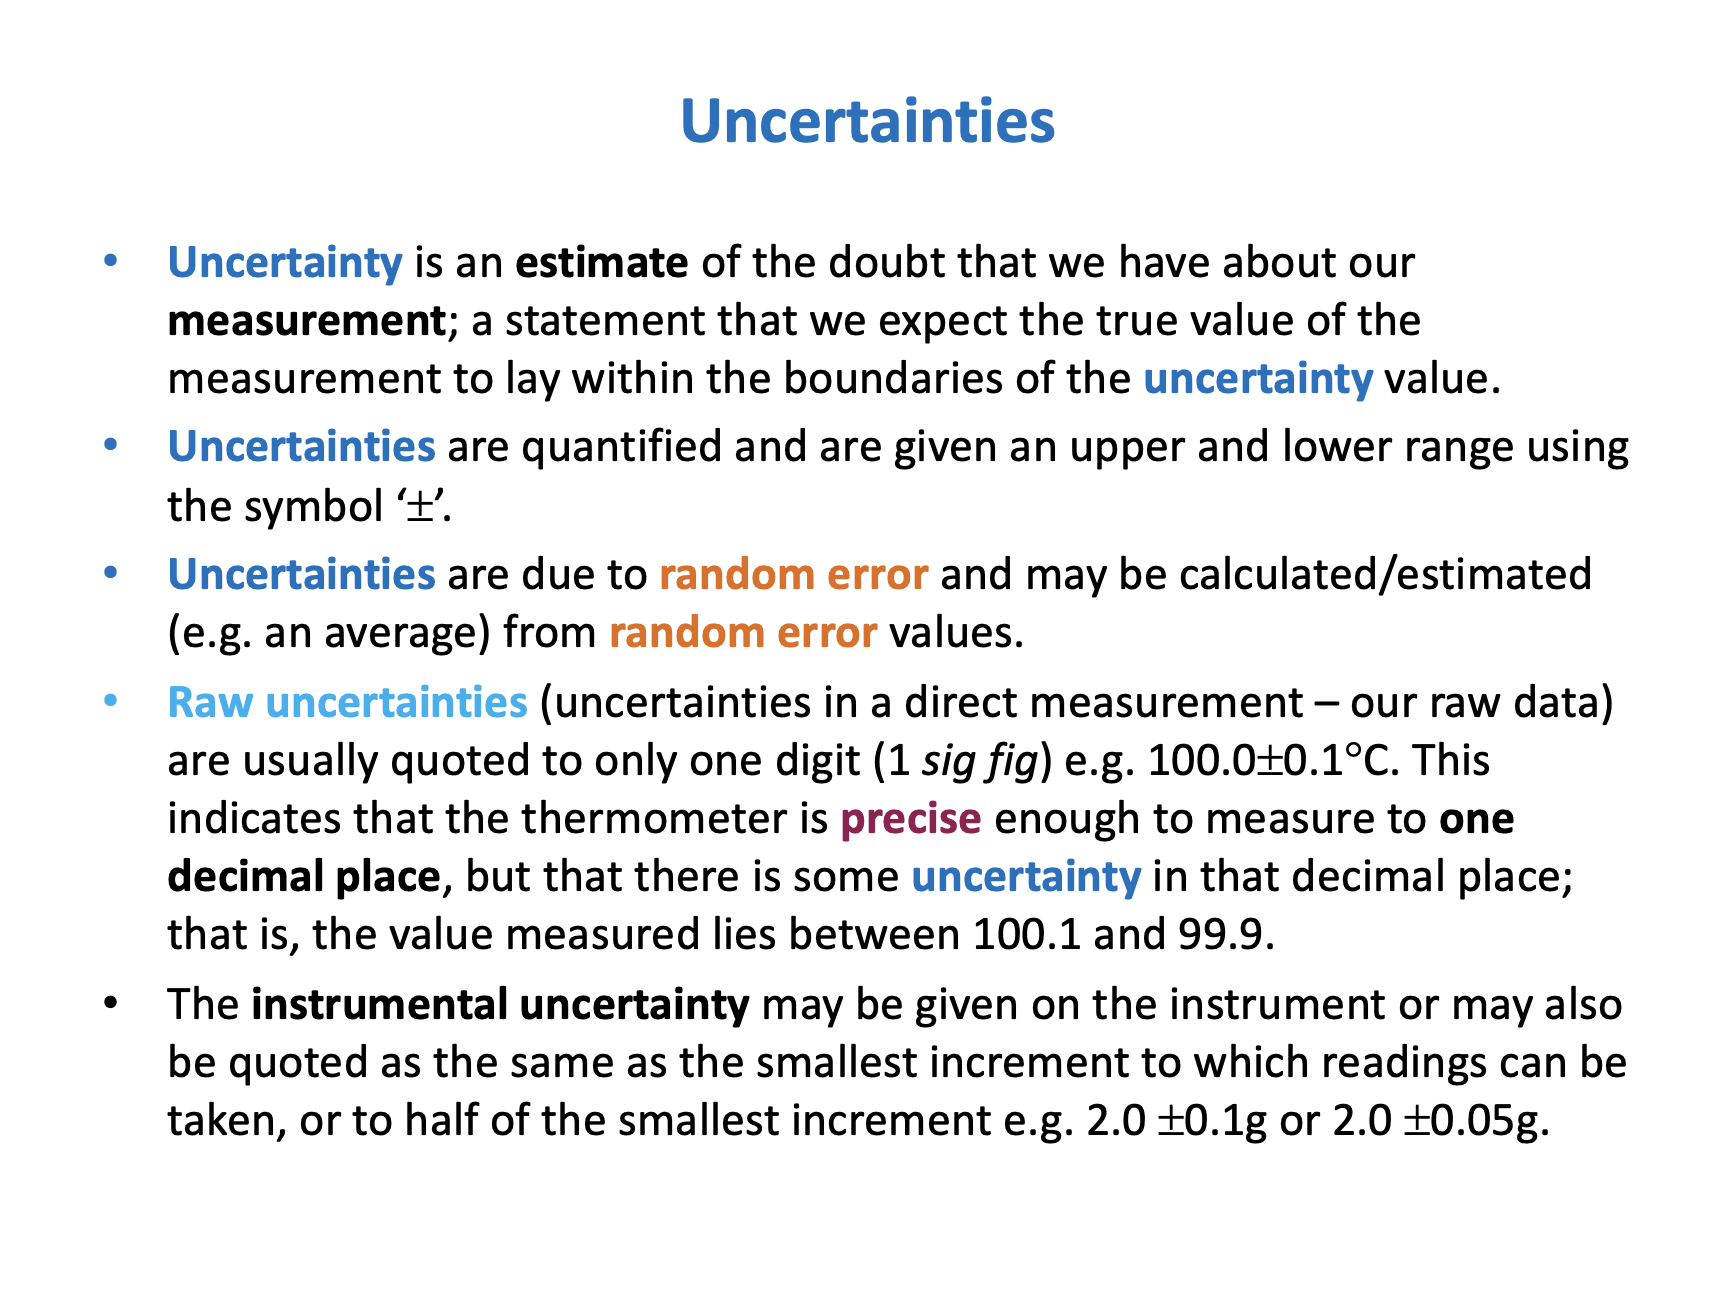
Which uncertainty is the most appropriate for taking a 3.000g mass reading on a three decimal place balance?
It is conventional in chemistry to quote raw uncertainties to one significant figure, and to the same precision (decimal places) as the reading - thus ±0.001g is the correct answer. Although It is acceptable to quote uncertainties to half the smallest increment (±0.0005g) but that is not given as an option here.
The table displays a set of volume measurements for a titration where the burette tap is consistently closed one second too late:
Volume (±0.05 cm3) |
20.15 |
20.10 |
20.10 |
The set of data is:
Precision can be defined as data points being close together, which this data shows. However, the systematic error due to the tap consistently being closed too late (as mentioned in the question) renders the data inaccurate. (Accuracy is closeness to the true value.)
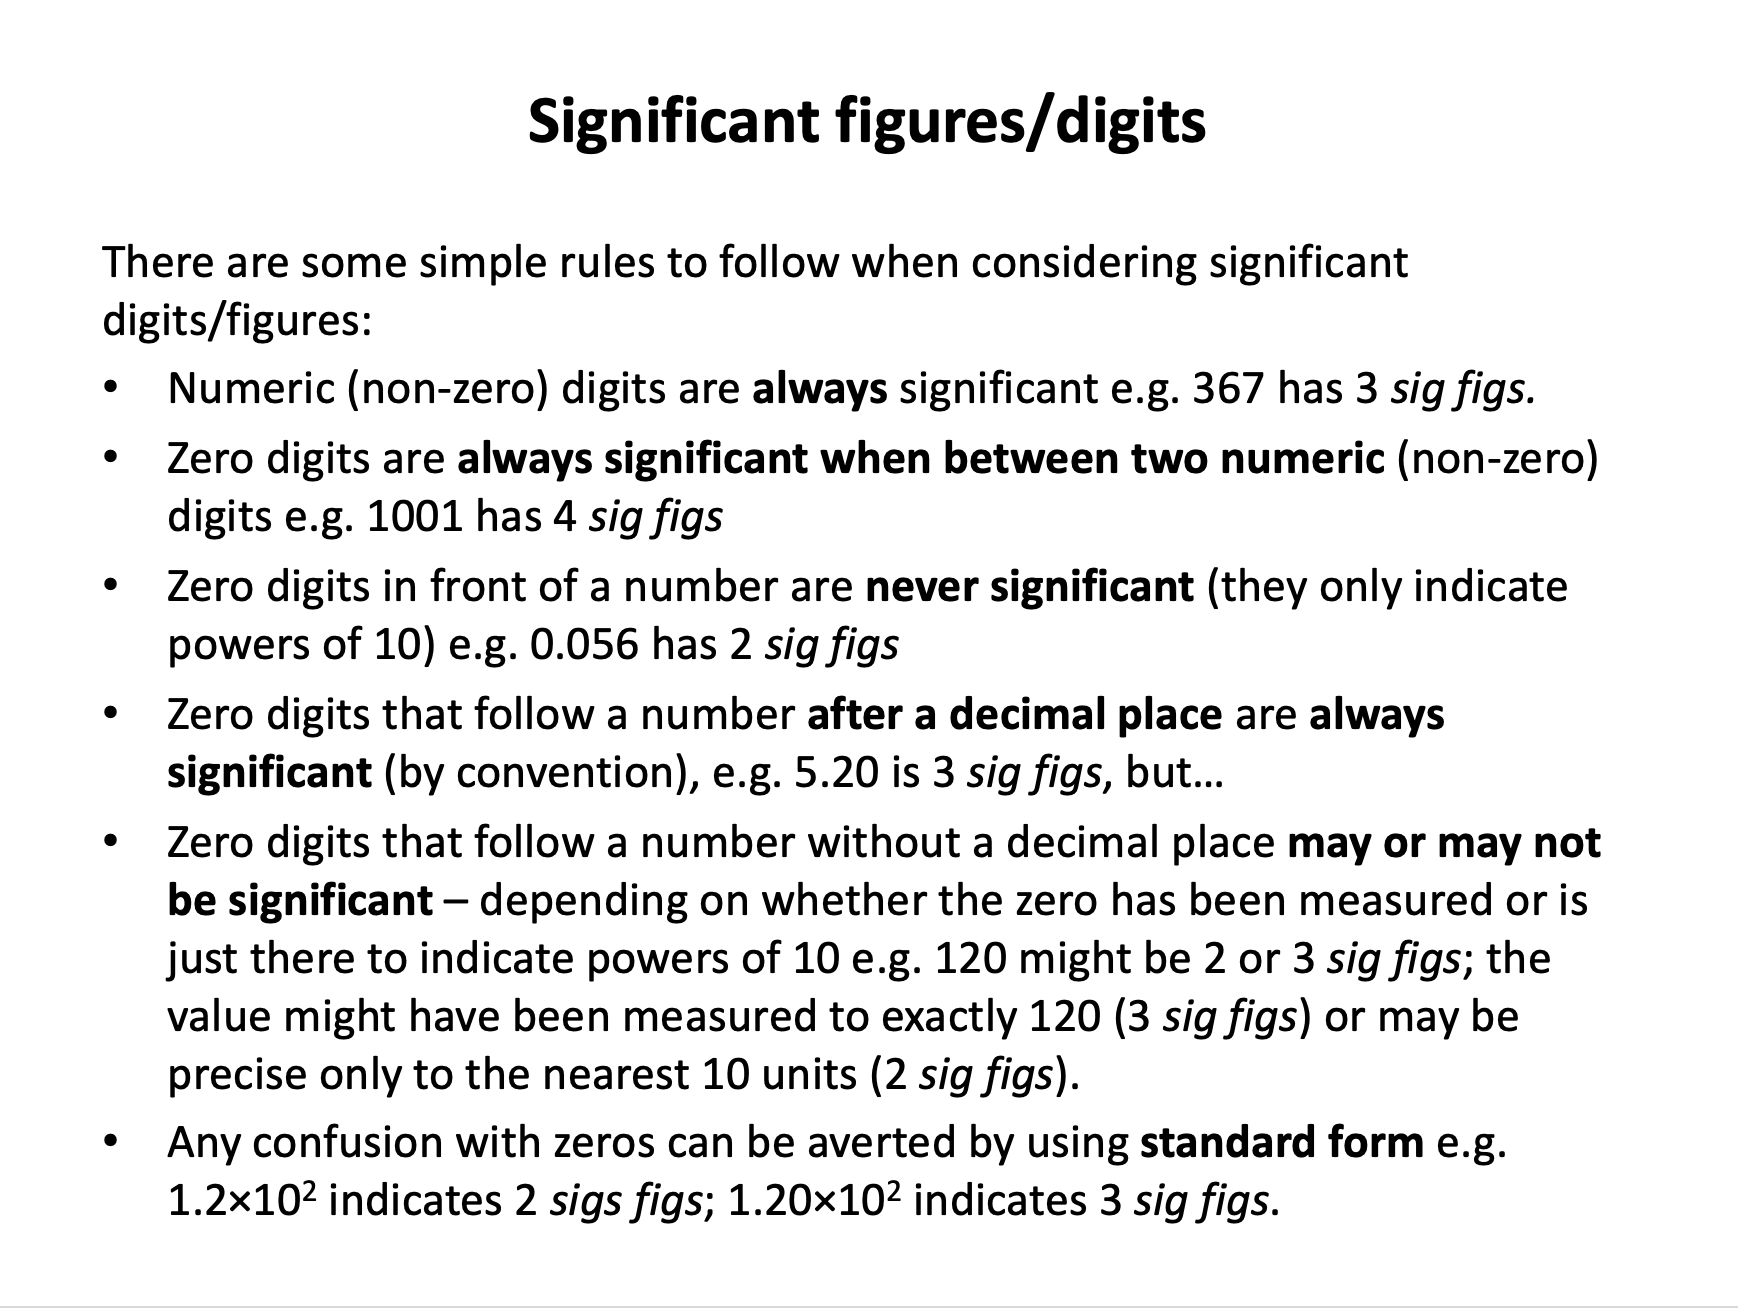
How many significant figures in the value 5.100?
There are 4 significant figures in this value. See the highlighted rule below.
There are some simple rules to follow when considering significant digits/figures:
Numeric (non-zero) digits are always significant.
Zero digits are always significant when between two numeric (non-zero) digits.
Zero digits in front of a number are never significant (they only indicate powers of 10).
Zero digits that follow a number after a decimal place are always significant (by convention as they have been measured and found to be zero, which is why they are included), but
Zero digits that follow a number without a decimal place may be significant or may not be – depending on whether they have been measured and found to be zero, or are just there to indicate powers of 10.
How many significant figures in the value 1500?
We cannot know for sure; could be 2,3 or 4 is the correct answer. The problem is that we do not know if the zero digits have been measured and found to be zero, or are 'place holders' for powers of 10. This is why we use standard form: 1.5×10³ tells us that there are two sig figs; 1.500×10³ tells us that there are four sig figs.
There are some simple rules to follow when considering significant digits/figures:
Numeric (non-zero) digits are always significant.
Zero digits are always significant when between two numeric (non-zero) digits.
Zero digits in front of a number are never significant (they only indicate powers of 10).
Zero digits that follow a number after a decimal place are always significant (by convention as they have been measured and found to be zero, which is why they are included), but
Zero digits that follow a number without a decimal place may be significant or may not be – depending on whether they have been measured and found to be zero, or are just there to indicate powers of 10.
A student carries out an experiment to find heat energy, q, using the following data:
mass (m) is 5.442g; specific heat capacity (c) is 4.184 Jg–1K–1; initial temperature is 295K and final temperature is 307K
The calculation is as follows: q = mcΔT = 5.442 × 4.184 × 12 = 273.23194 J
Which final answer shows the appropriate number of significant figures?
The calculator value would be used if further calculations were going to be made.
However, as a final answer, the value should be given to 3 significant figures as this is the lowest number of significant figures in raw data measurements (of temperature).
Thus the correct answer is 273 J.
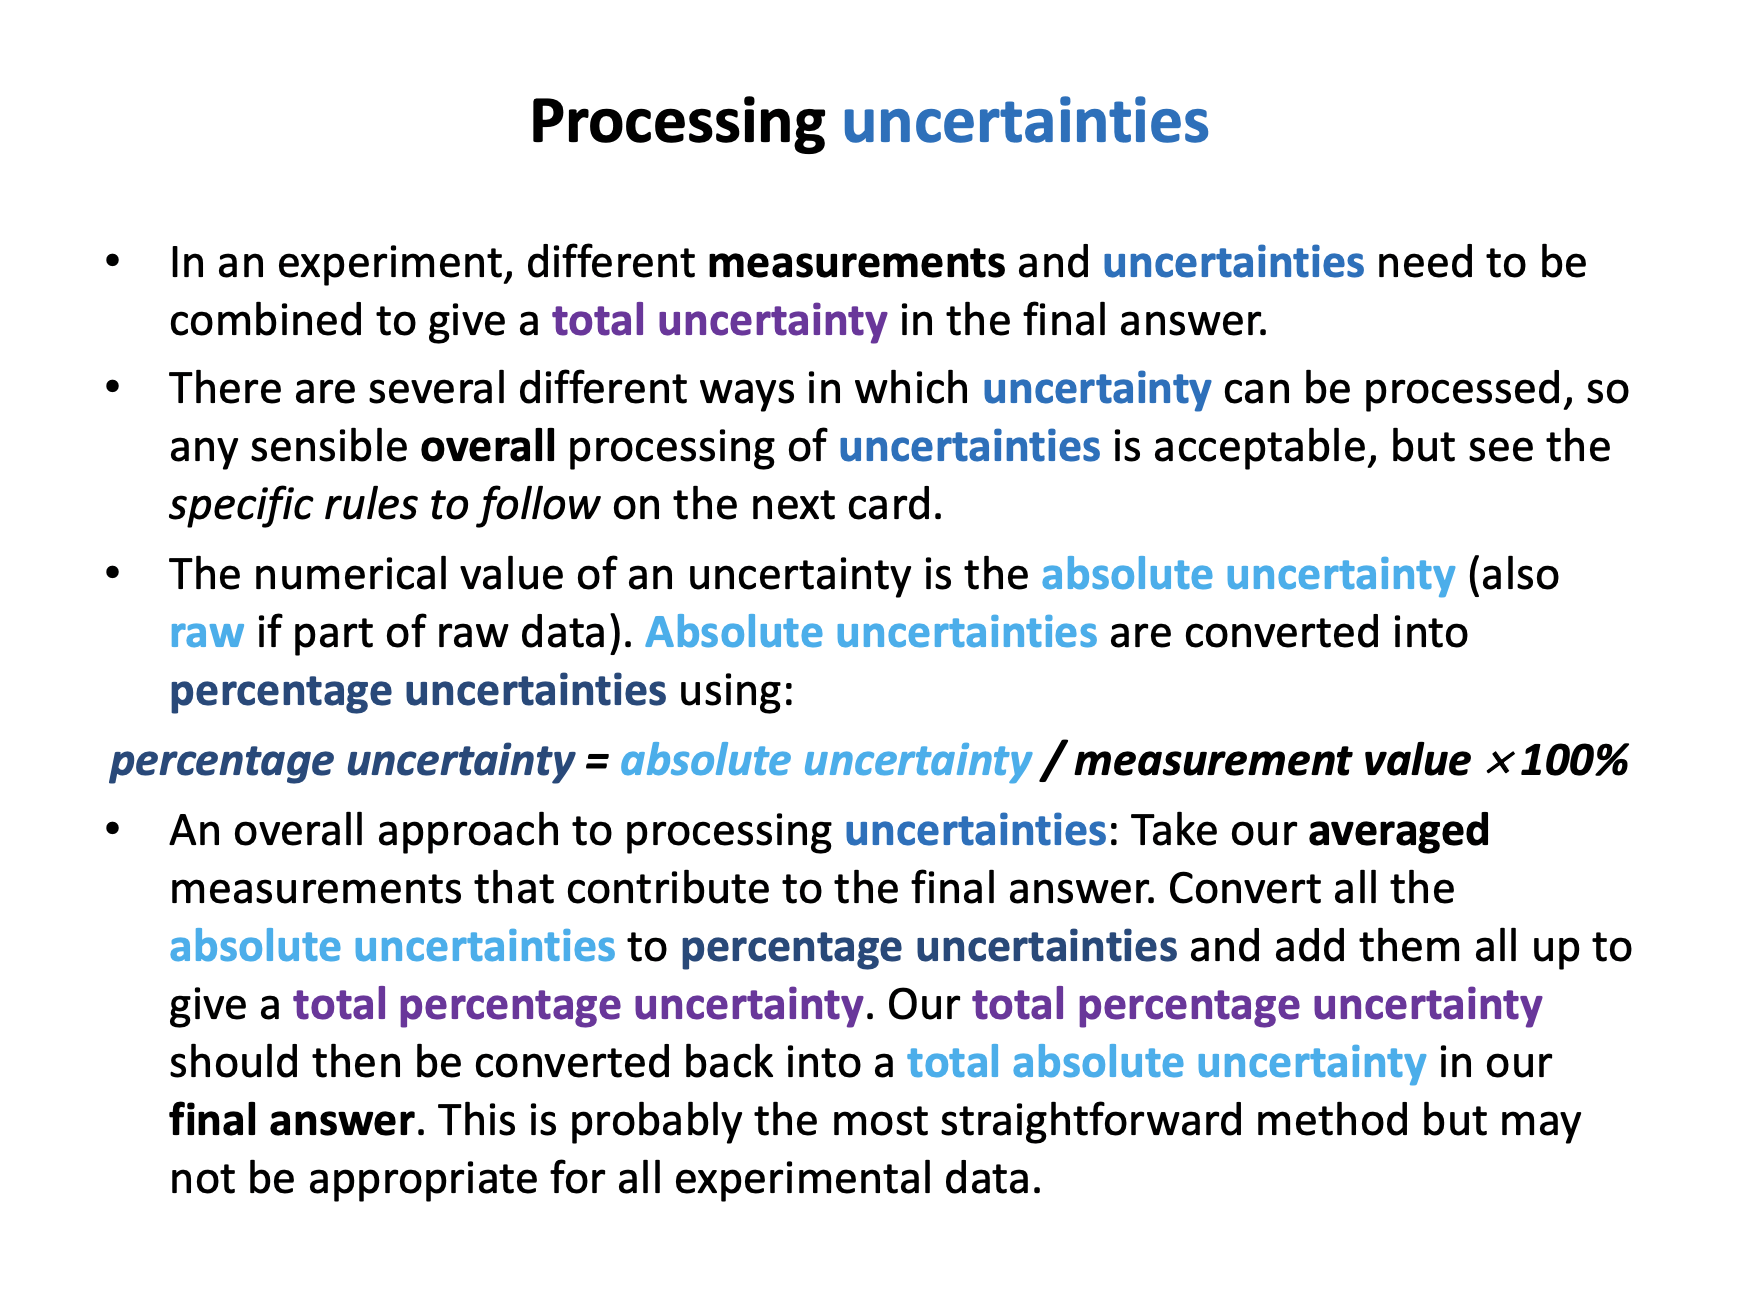
What is the percentage uncertainty of a temperature reading of 16.0±0.4°C?
Percentage uncertainty can be calculated:
Percentage uncertainty = (absolute uncertainty / measurement value) ×100%
In this example % uncertainty = 0.4 / 16.0 ×100% = 2.5 %
A student carries out a titration experiment. If the initial titration reading is equal to 1.60±0.05cm3 and the final titration reading is equal to 16.25±0.05cm3, what is the total titre with correct uncertainty?
To calculate the total titre, the initial reading should be subtracted from the final reading: 16.25−1.60=14.65
The two uncertainties should be added together to find the total uncertainty: 0.05+0.05=0.10
Thus the correct answer is 14.65±0.10cm3
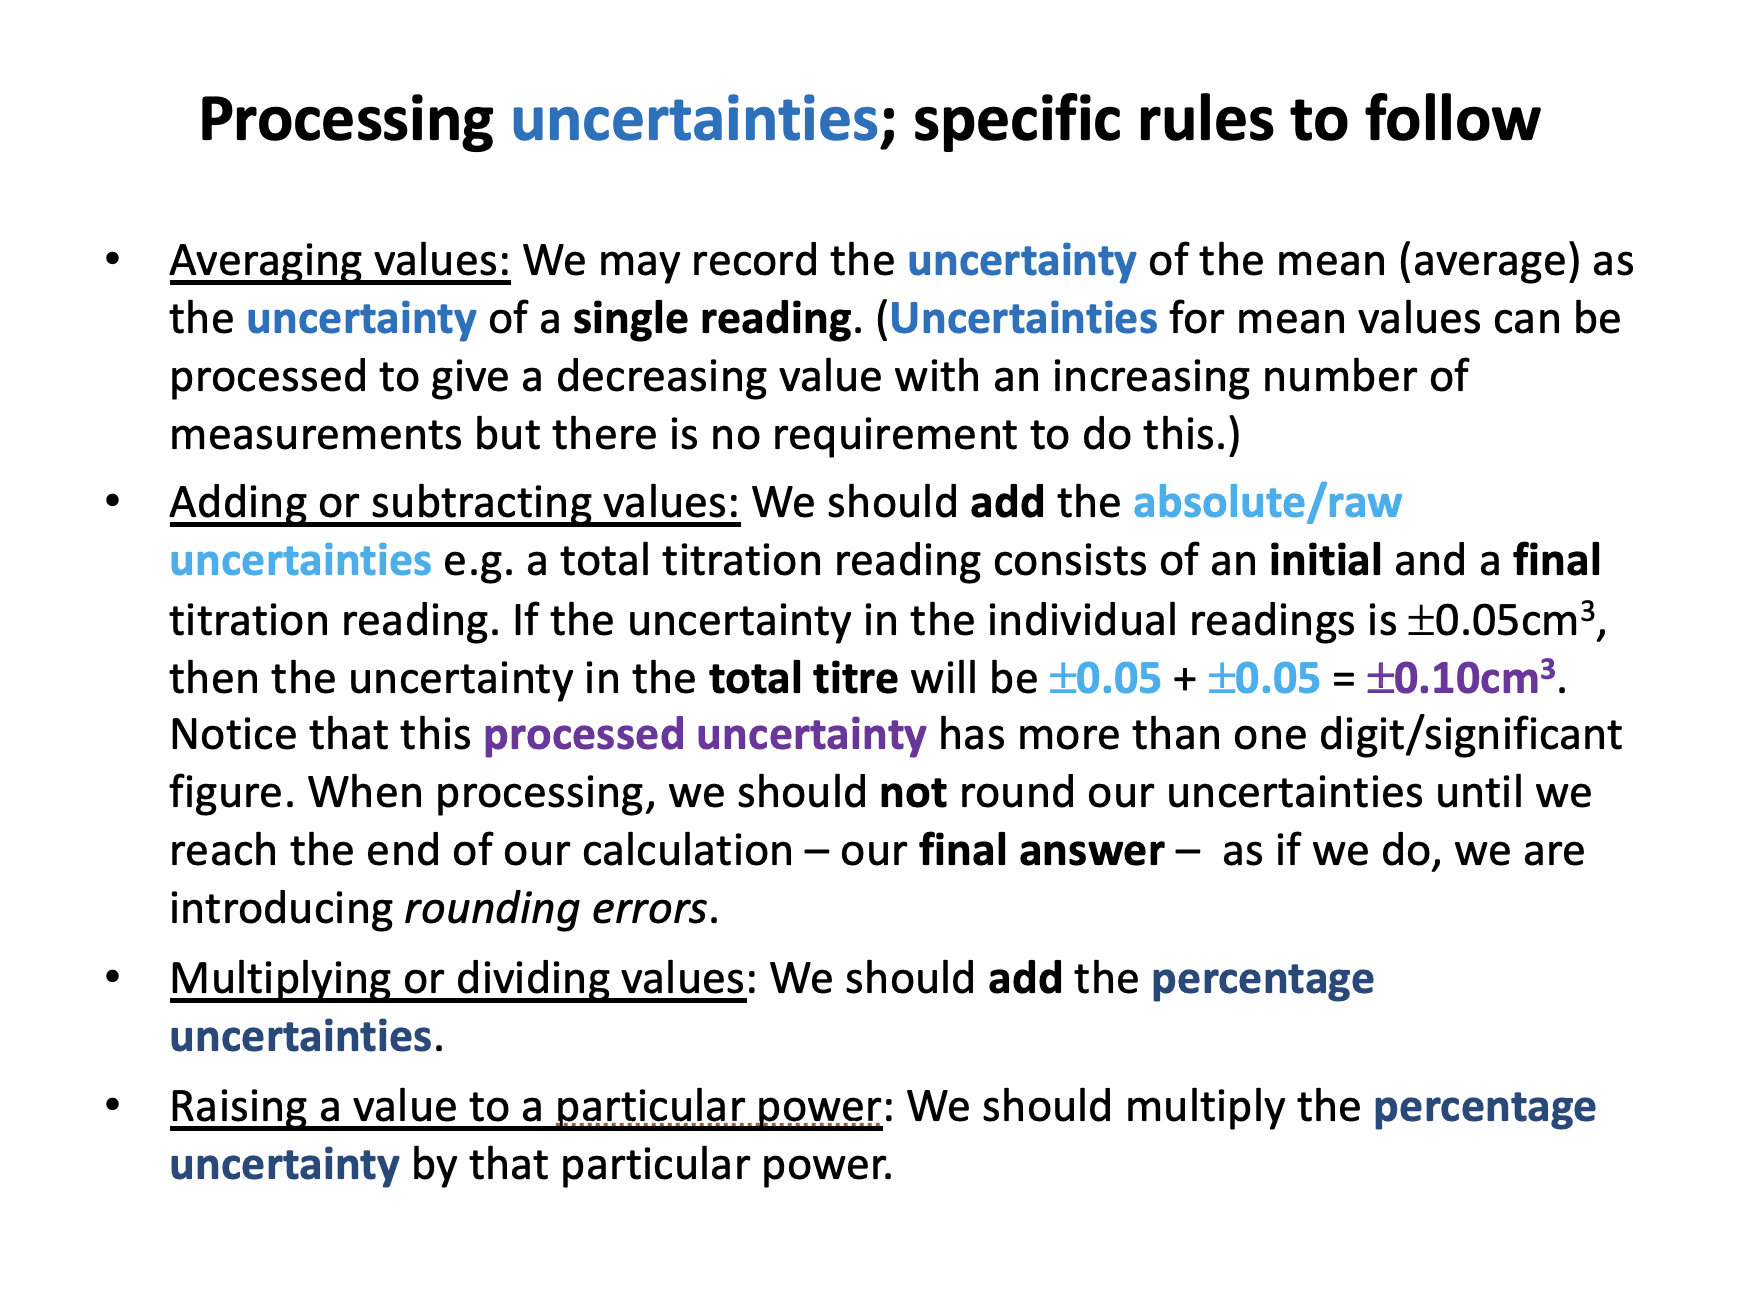
Processing uncertainties
Averaging values: You may record the uncertainty of the mean (average) as the absolute uncertainty of a single reading. (Uncertainties for mean values can be processed to give a decreasing uncertainty value with an increasing number of measurements, but there is no requirement to do this at your level of study.)
Adding or subtracting values: You should add the absolute uncertainties together. E.g. a total titration reading consists of an initial and a final titration reading. If the uncertainty in the individual readings is ±0.05cm3, then the uncertainty in the total titre will be 0.05+0.05=0.10. Notice that this processed uncertainty has more than one significant figure. When processing, do not round your uncertainties until you reach the end of your calculation – your final answer.
Multiplying or dividing values: You should add the percentage uncertainties.
Raising a value to a particular power: You should multiply the percentage uncertainty by that particular power.
A student records their final answer for a rate experiment calculation as follows:
Rate of reaction = 0.56±0.009 mol dm−3 min−1
Assuming the values are correct, but that student has not rounded appropriately; how should the student have recorded their final answer?
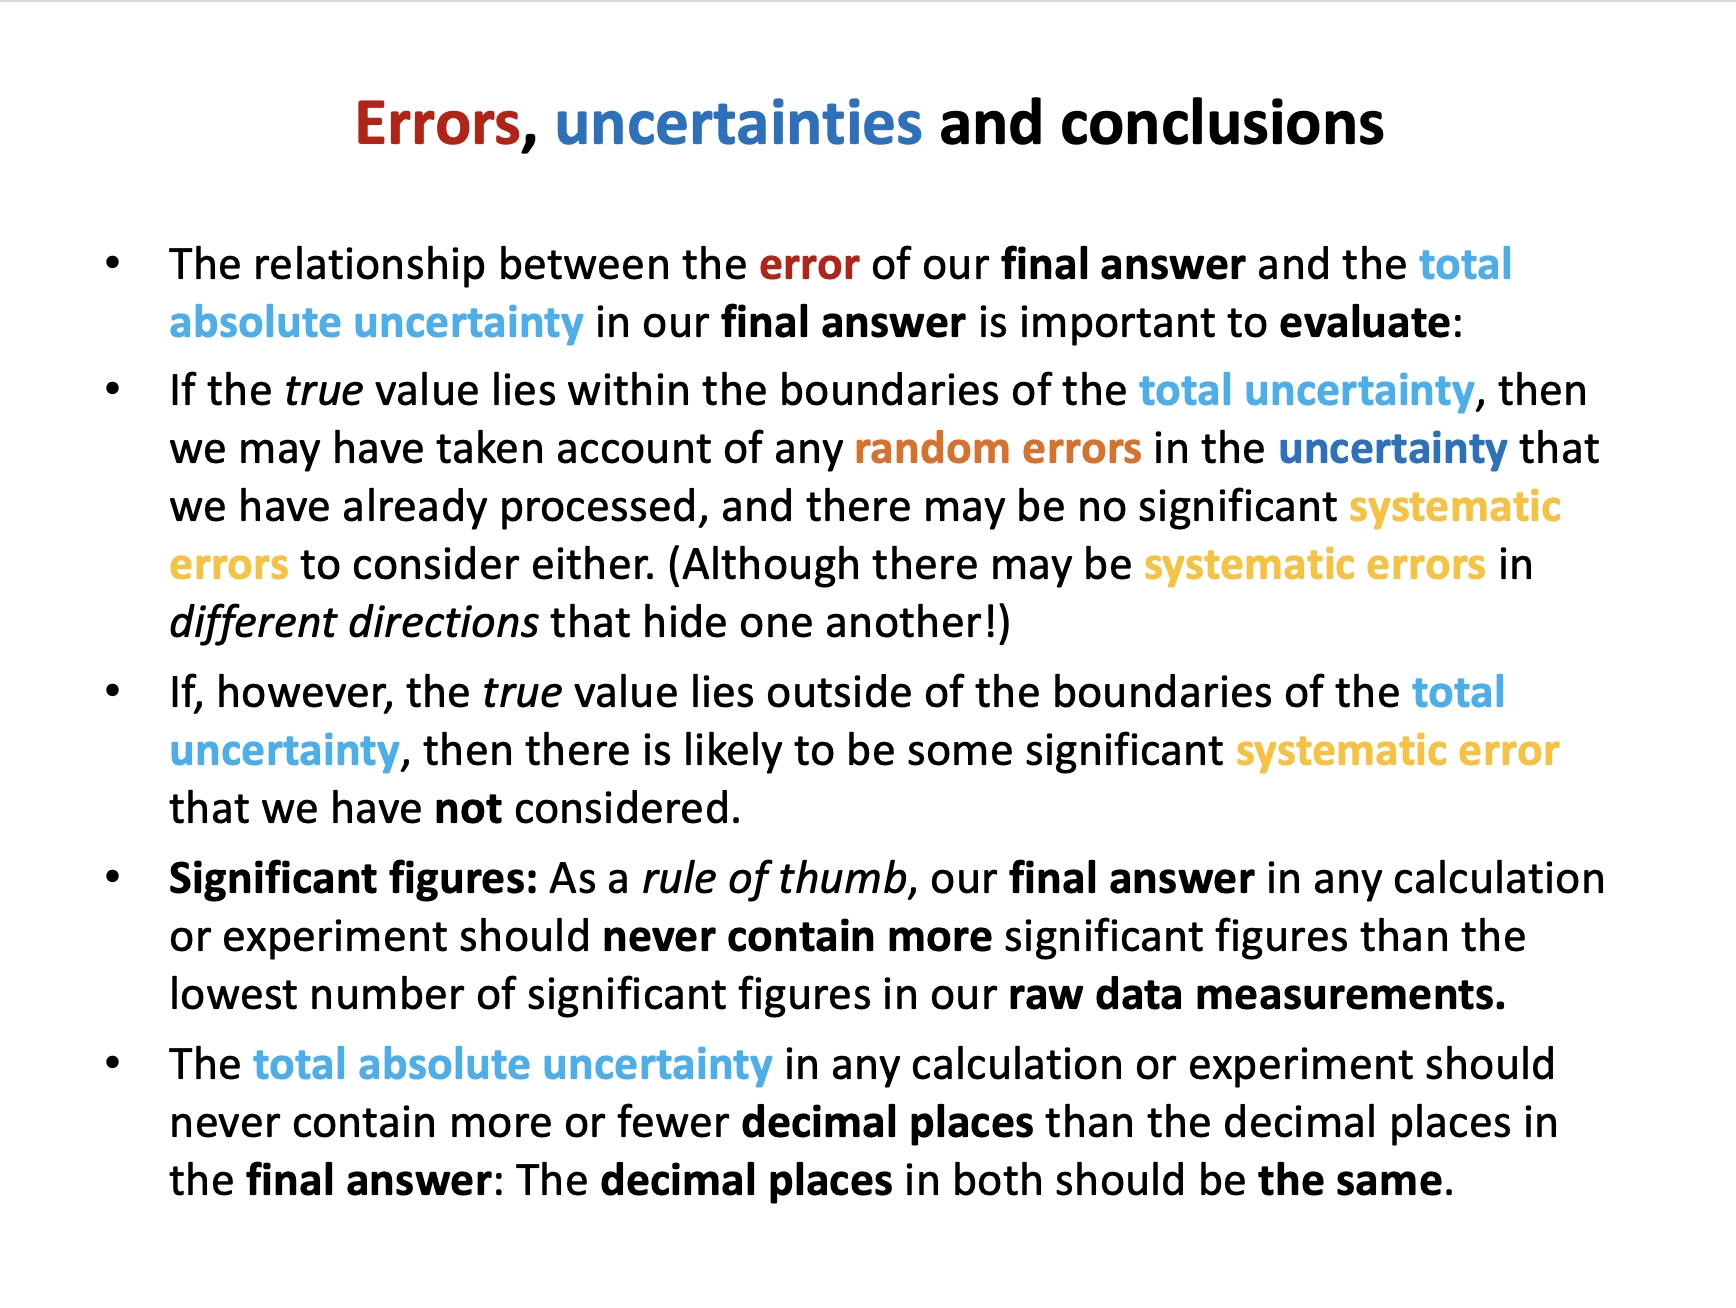
The student has recorded their final answer with a different number of decimal places in the answer and the uncertainty. The final uncertainty in any calculation or experiment should never contain more or fewer decimal places than the decimal places in the final answer: The decimal places in both should be the same.
Here the uncertainty contains more decimal places, so should be rounded down to two decimal places (the same as the value). The correct answer is 0.56±0.01 mol dm−3 min−1
Note: It is not correct to add zero to the value (0.560±0.009) as this suggests that the zero has been measured and found to be zero (which it has not - it has just been added).
Has the following data set been affected by random error and/or systematic error?
The repeated calculation from titration data of the concentration of a limewater solution at 20°C giving values of 0.042; 0.052; 0.033; 0.041; 0.039 ±0.002mol dm–3, when the true value is 0.023 mol dm–3
The data set appears to be distributed (very) randomly about a value that is higher than the true value, so is likely to have been affected by random error and also by systematic error (perhaps an inappropriately chosen indicator).
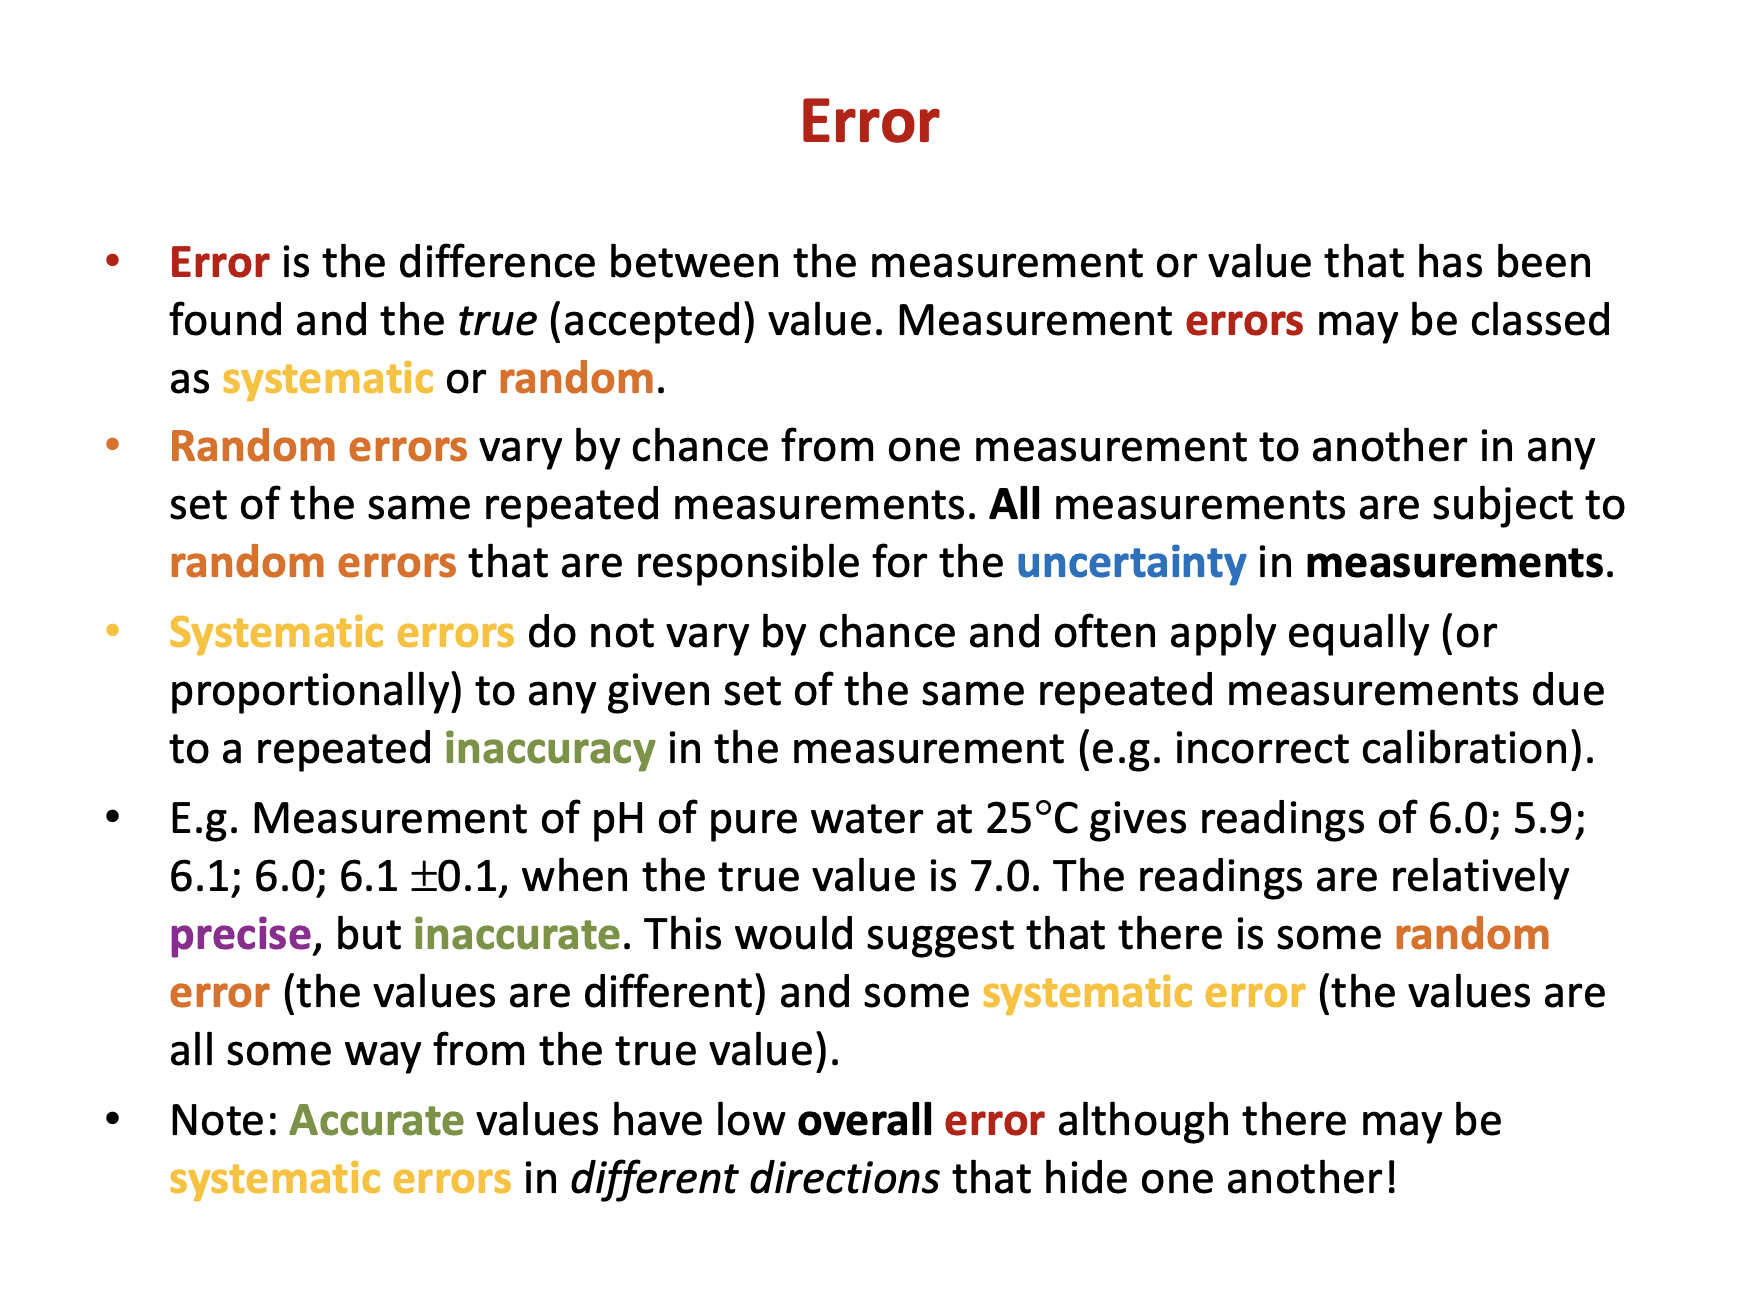
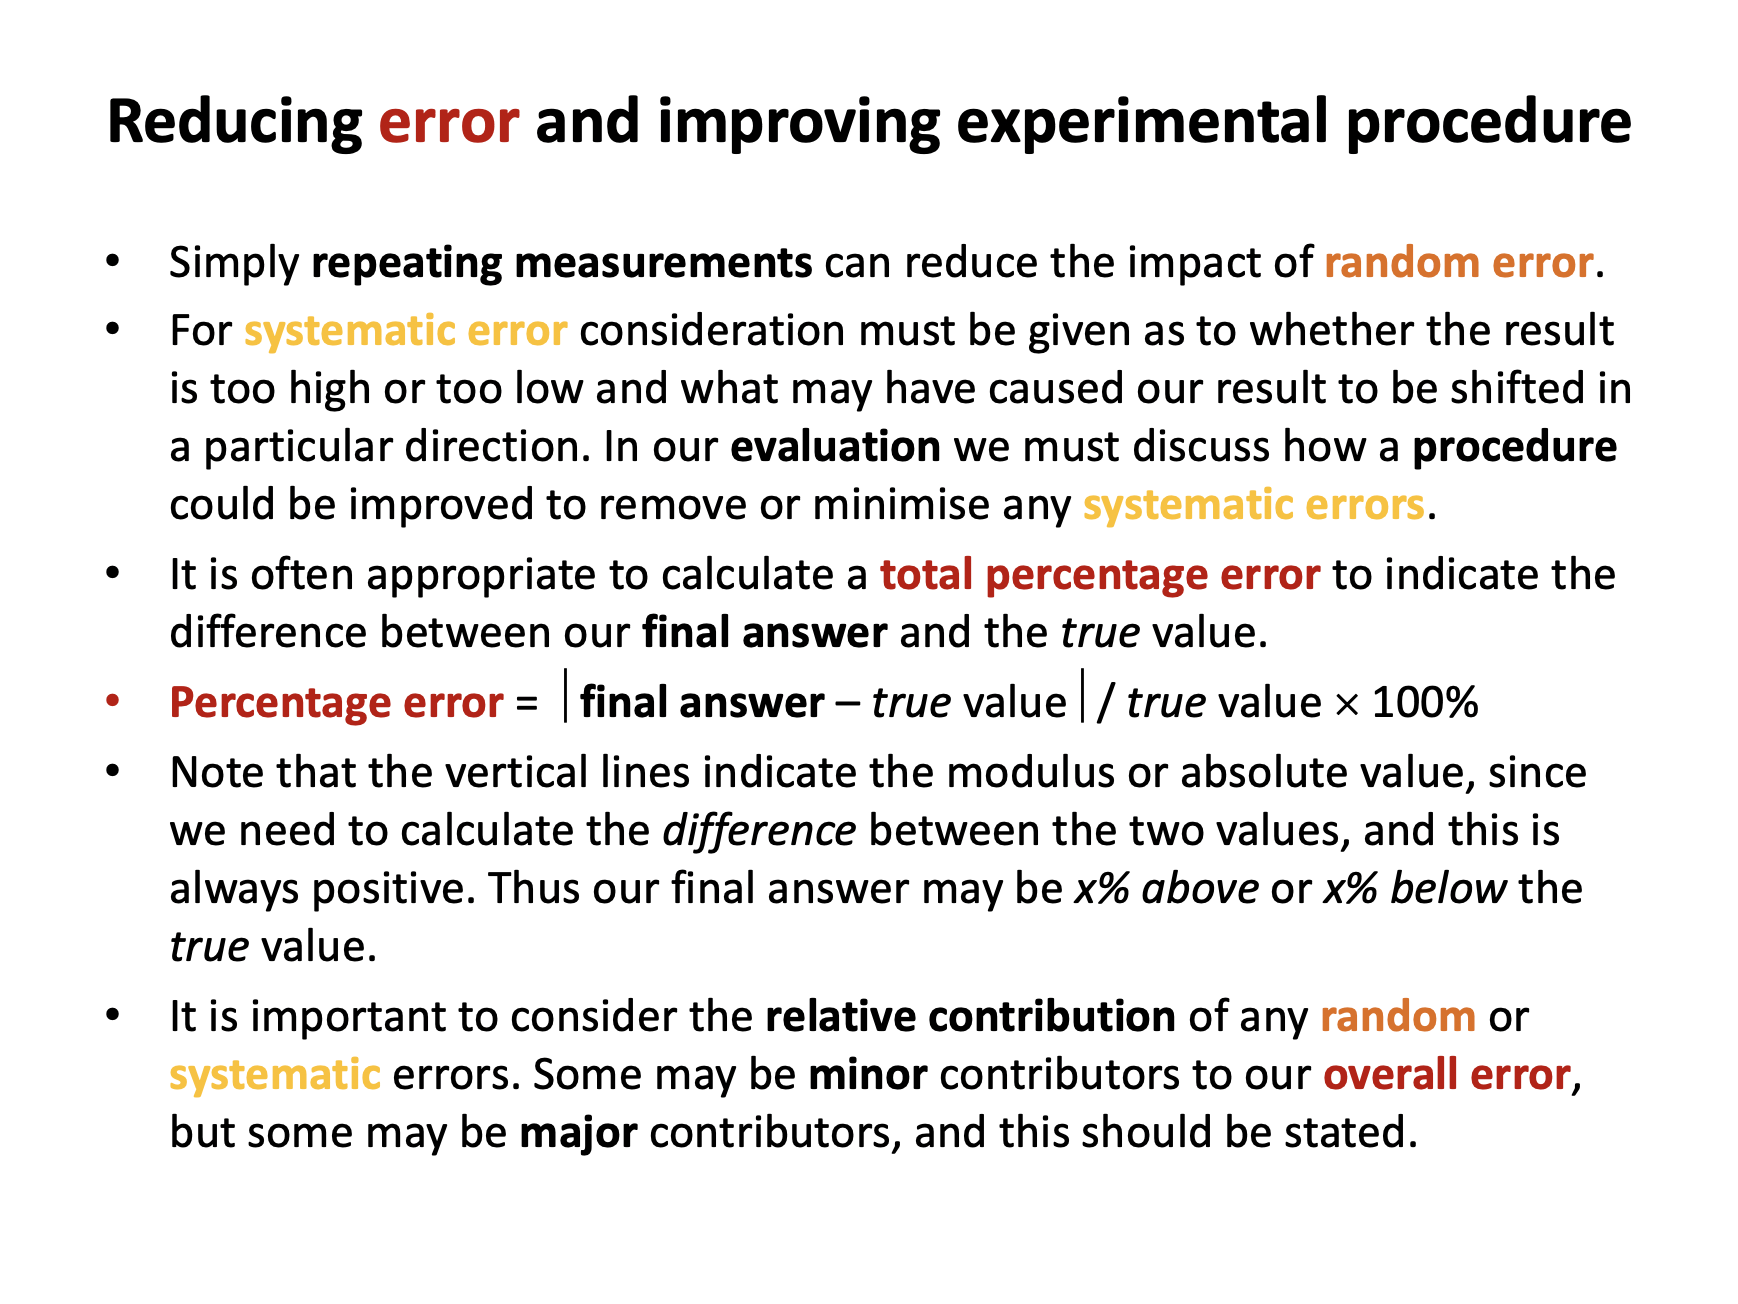
All measurements are affected by random error and may also be affected by systematic error.
Random errors vary by chance and do not apply equally to any given set of the same repeated measurements. Random errors are responsible for the uncertainty in instrument readings.
Systematic errors do not vary by chance and often apply equally (or proportionally) to any given set of the same repeated measurements.
Paper 1
Core (SL&HL): Measurement core (SL and HL) paper 1 questions
AHL (HL only): Measurement AHL (HL only) paper 1 questions
Paper 2
Core (SL&HL): Measurement core (SL & HL) paper 2 questions
AHL (HL only): Measurement AHL (HL only) paper 2 questions
How much of Uncertainties, errors and graphs have you understood?
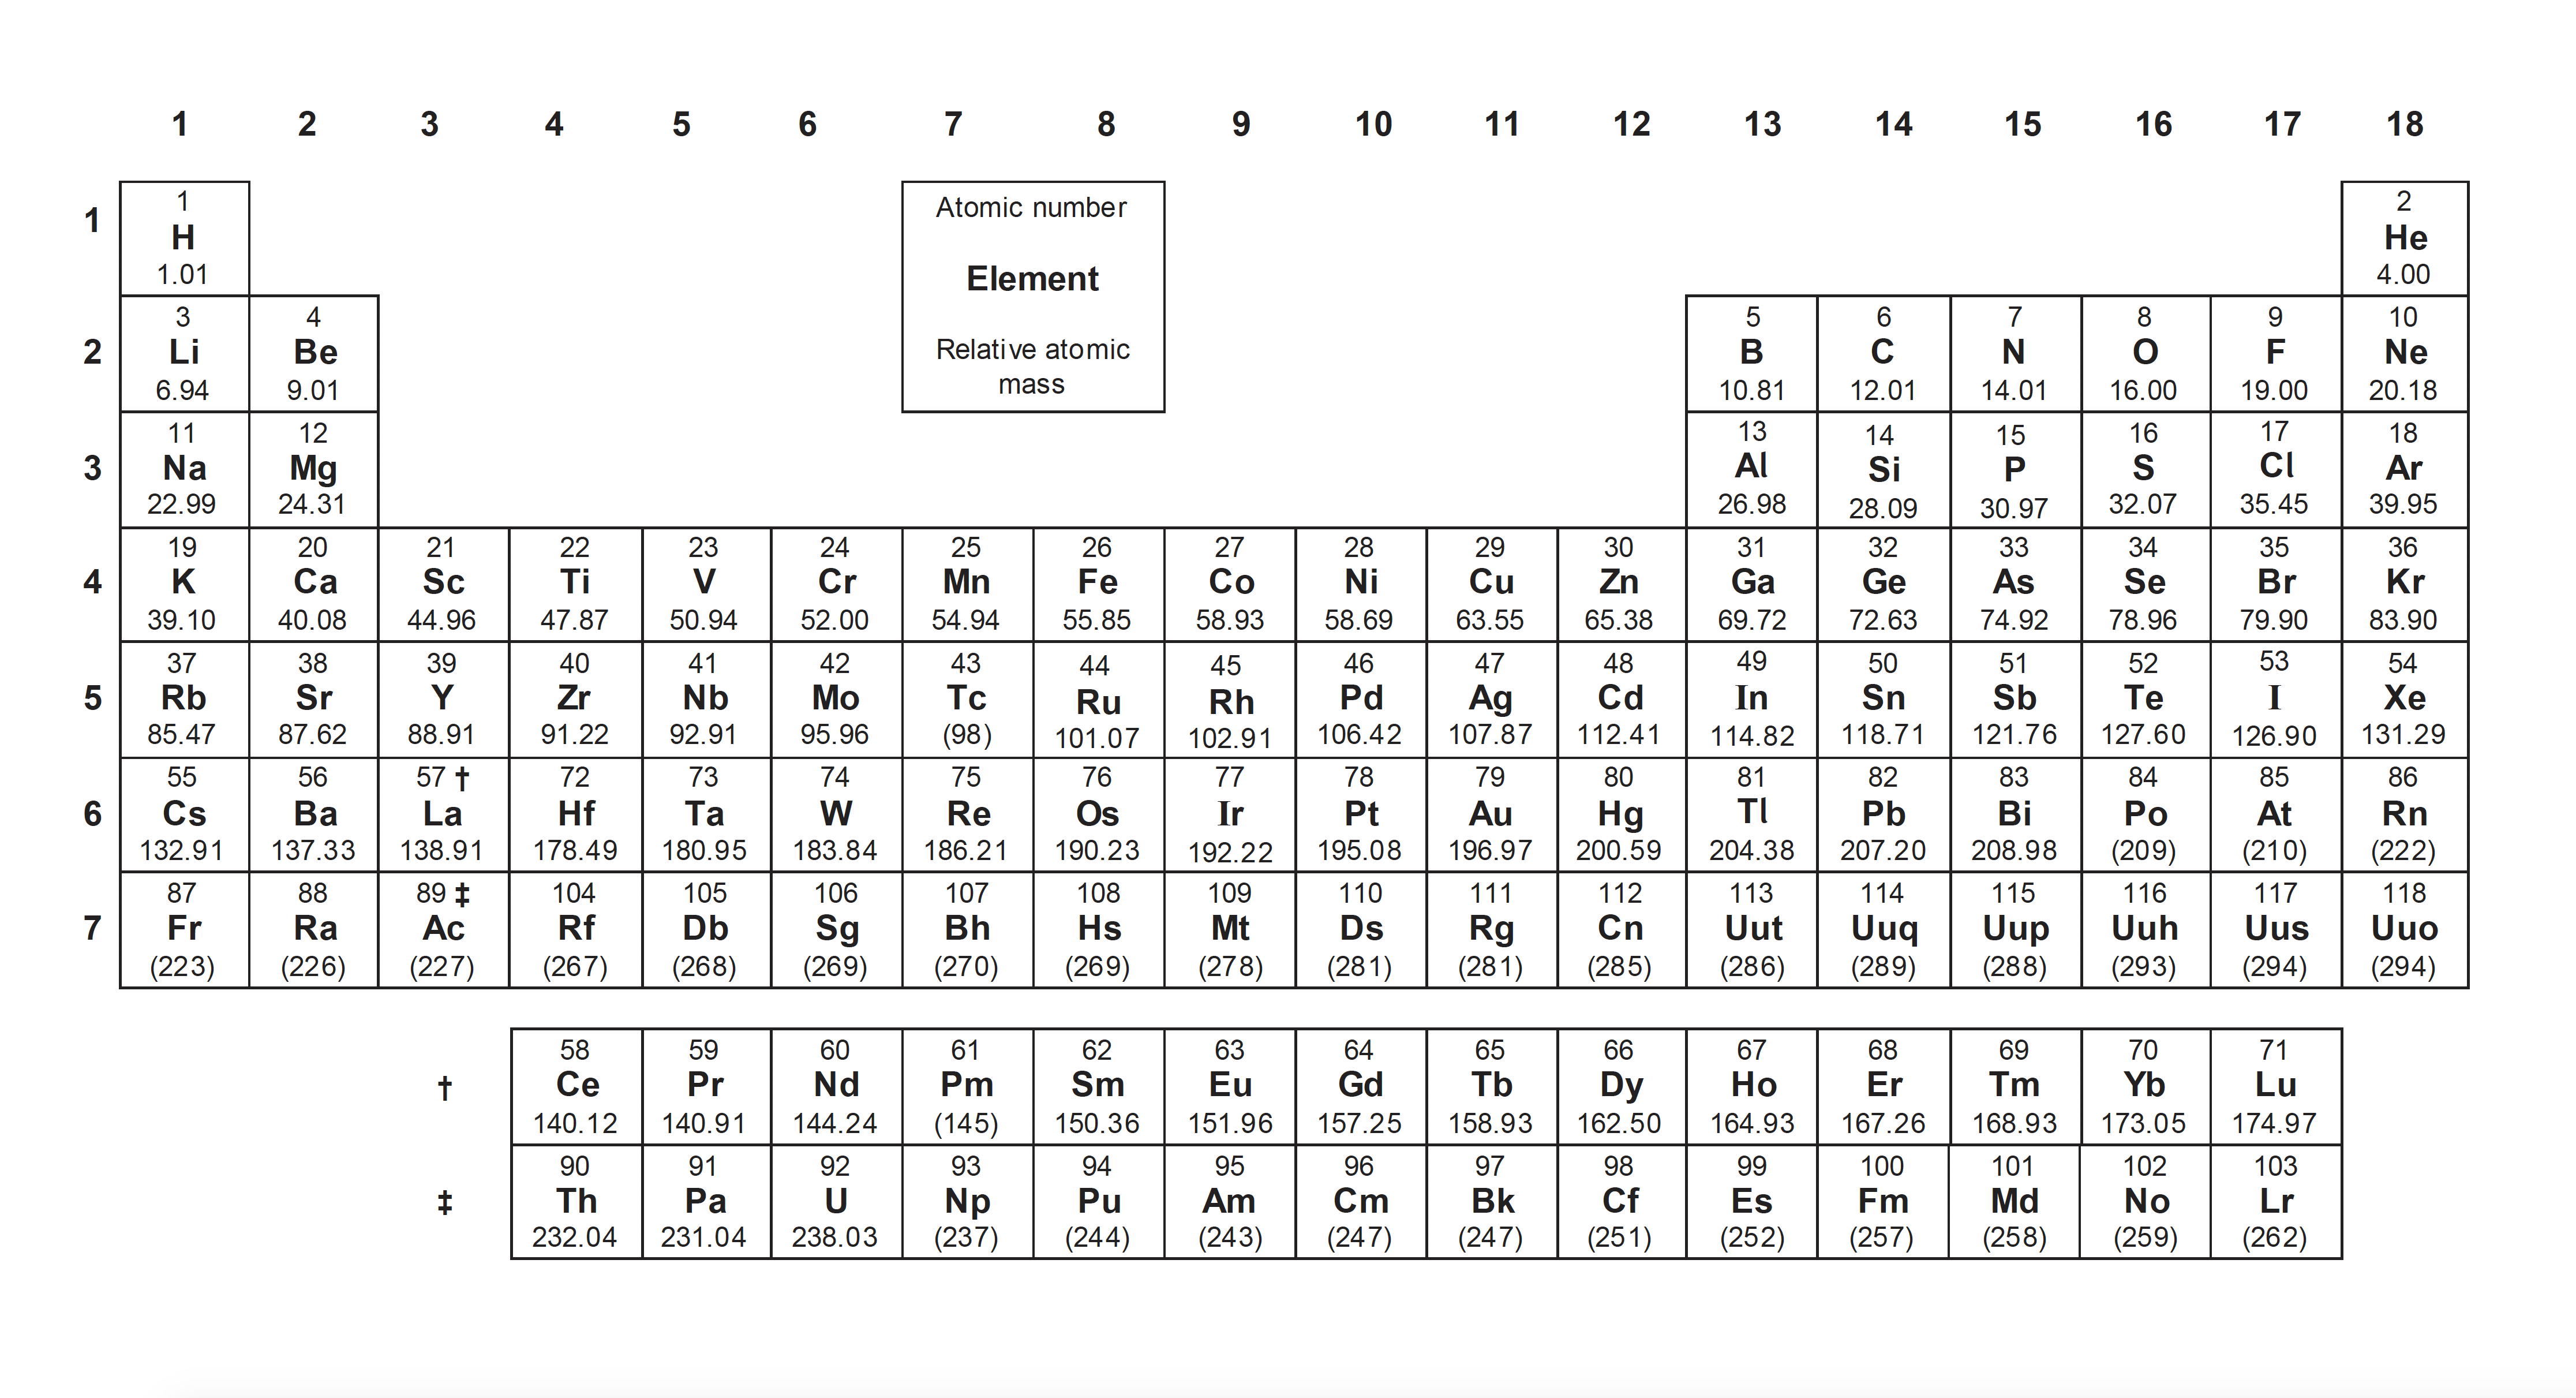
Periodic table
 Twitter
  Facebook
  LinkedIn