11.1 Uncertainty & errors
Written specifically for students to provide help and support for the IB Diploma chemistry programme this page provides full coverage of the syllabus content of Topic 11.1 Uncertainty & errors. It encourages you to think critically and provides many questions with full worked answers so that you can monitor and improve your knowledge and understanding.
.png) Learning outcomes
Learning outcomes
After studying this topic you should be able to:
 Understand:
- Qualitative data are not obtained from measurement but include all non-numerical information obtained from observations.
- Quantitative data are obtained from measurements. They are affected by human limitations such as reaction times and are always associated with random errors/uncertainties, determined by the apparatus used to measure them.
- The impact of the uncertainties on the final result is shown by the propagation of random errors in data processing.
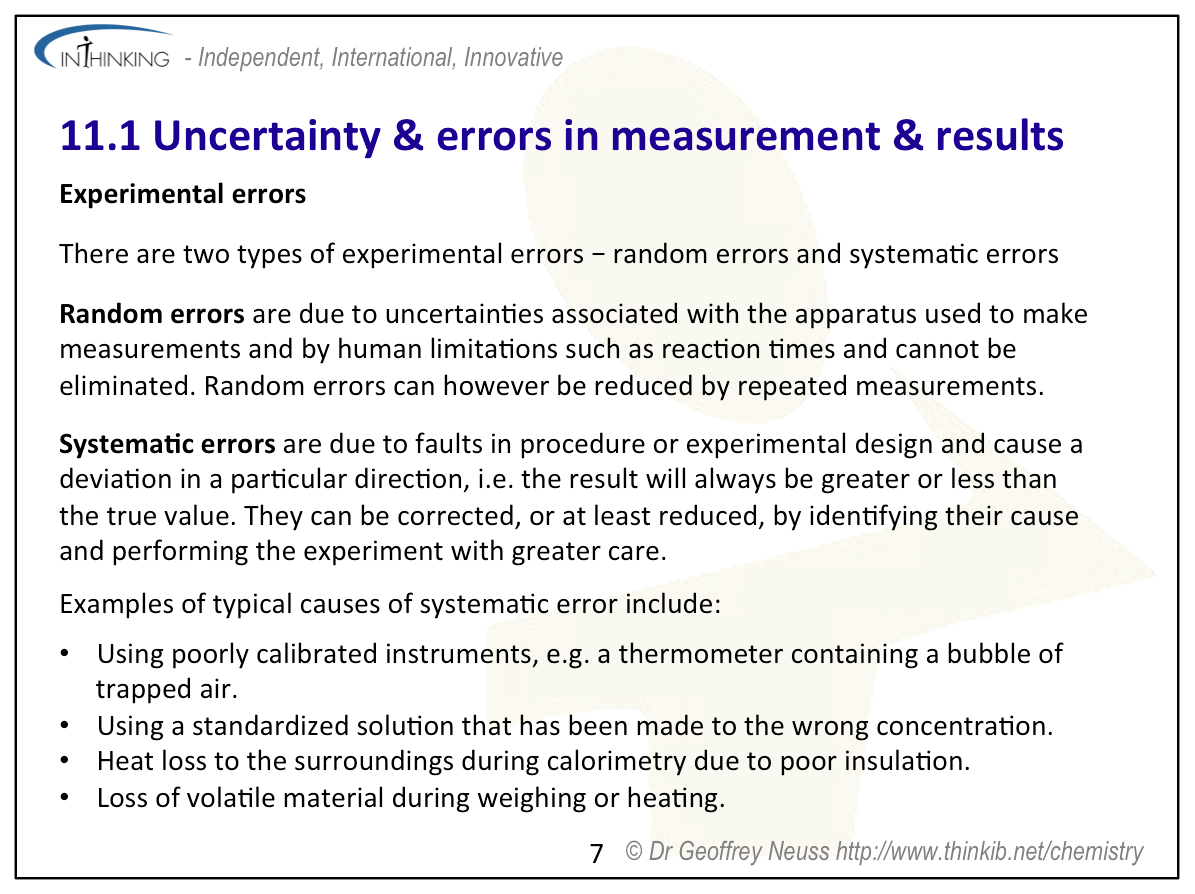
- Systematic errors in measurement are caused by experimental design and procedure and normally lead to a deviation in a particular direction.
- Random errors, but not systematic errors, will be reduced by repeated trials and measurements.
Apply your knowledge to:
- Distinguish between random errors and systematic errors.
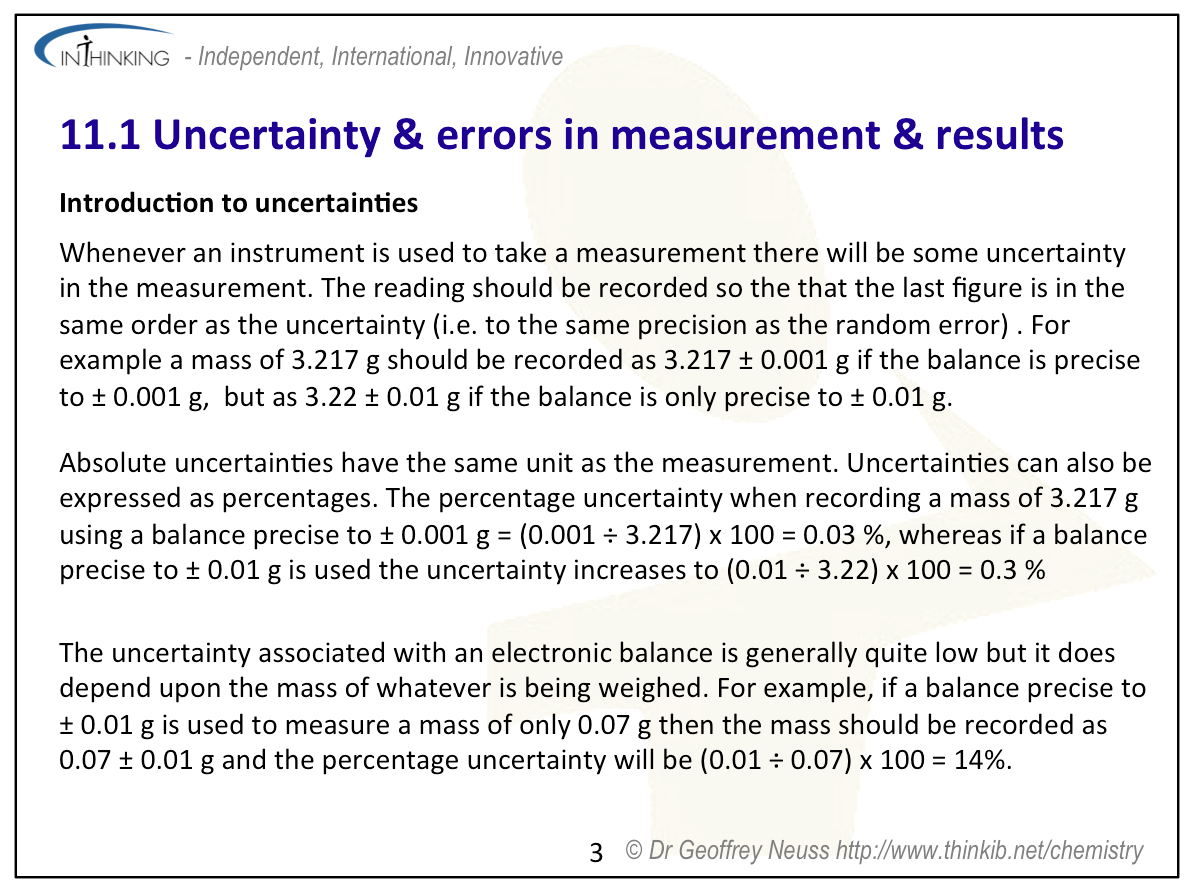
- Record all measurements together with their associated uncertainties as a range (±) to an appropriate precision.
- Discuss ways to reduce uncertainties in an experiment.
- Propagate uncertainties in processed data, including the use of percentage uncertainties.
- Discuss the impact of systematic errors on the results obtained in all experimental work and how they can be reduced.
- Estimate whether particular sources of error are likely to have a major or minor effect on the final result.
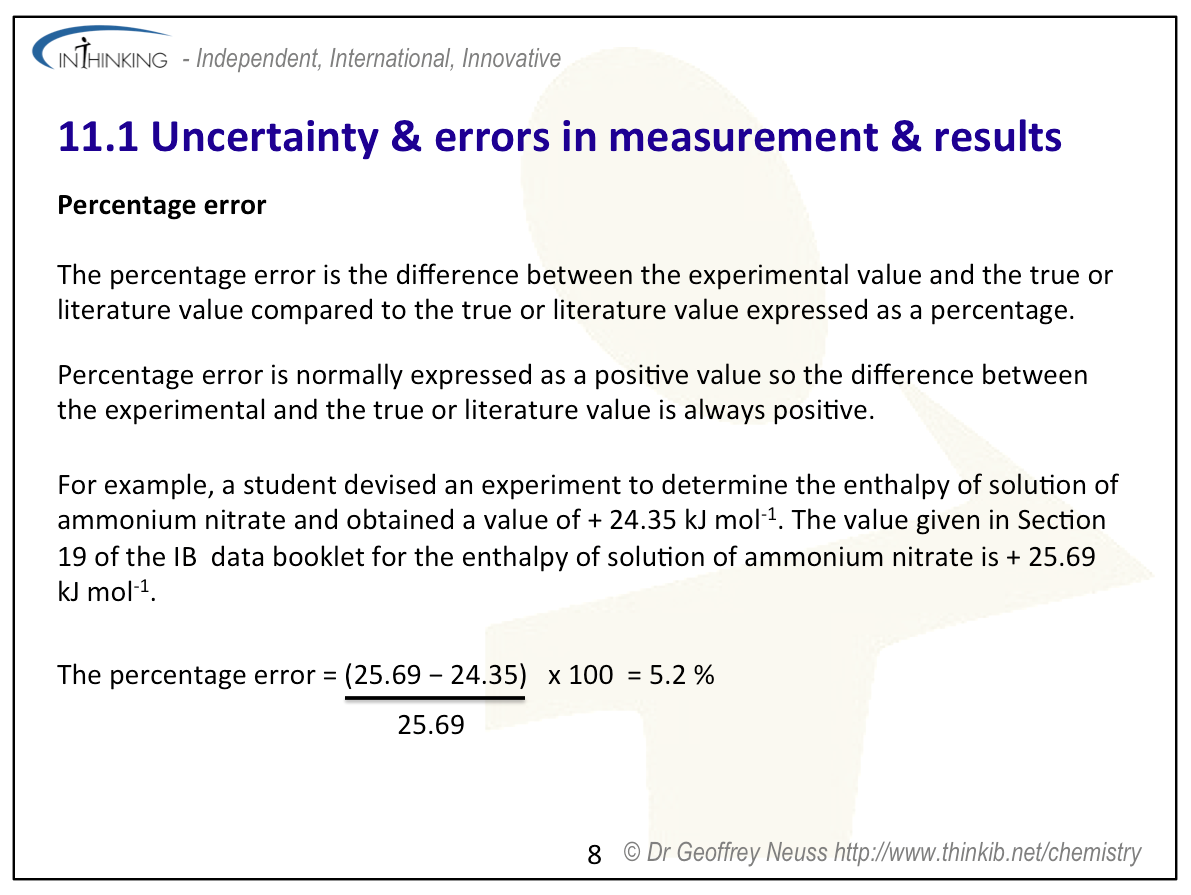
- Calculate the percentage error by comparing the experimental result with a theoretical or accepted result whenever possible.
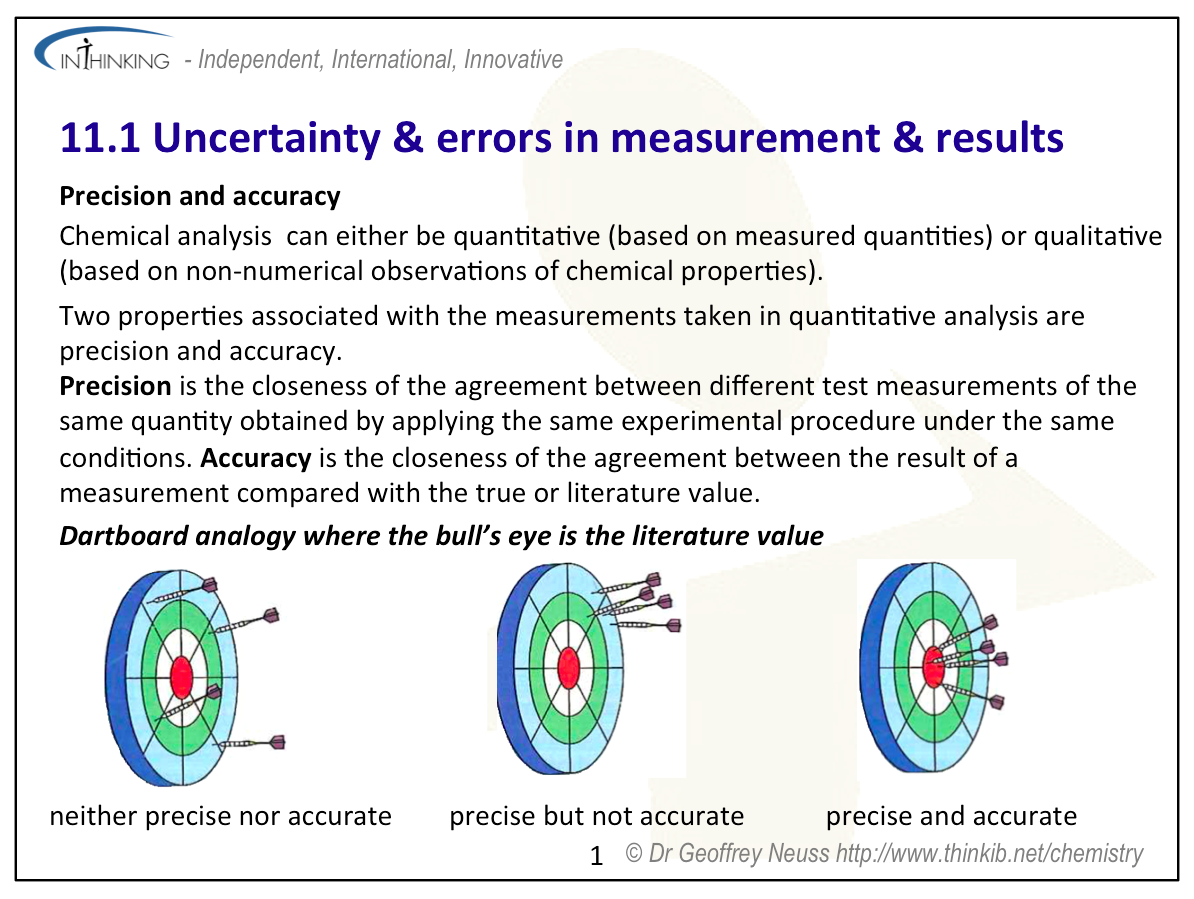
- Distinguish between accuracy and precision when evaluating results.
Relationships & vocabulary
Nature of science
Replication of quantitative measurements is crucial to ensure reliability—precision, accuracy, systematic, and random errors can only be interpreted properly through replication.
International-mindedness
The International Standards Organization (ISO) published the Guide to the Expression of Uncertainty in Measurement in 1995. This was a result of seven international organizations, including IUPAC, collaborating together. It has been translated into several different languages and has been widely adopted in most countries.
For more examples and links to International mindedness, Theory of knowledge, utilization etc. see separate page which covers all of Topics 11 & 21 : Measurement, data processing and analysis.
Vocabulary
| quantitative data | error | random error | systematic error |
| uncertainty | percentage uncertainty | qualitative data |
Learning slides
You can use this slide gallery for learning or for reviewing concepts and information. It covers all the key points in the syllabus for this sub-topic.
Uncertainty & errors in measurement & results:
Uncertainty & errors in measurement & results:
Uncertainty & errors in measurement & results:
Uncertainty & errors in measurement & results:
Uncertainty & errors in measurement & results:
Uncertainty & errors in measurement & results:
Uncertainty & errors in measurement & results:
Uncertainty & errors in measurement & results:
Uncertainty & errors in measurement & results:
Uncertainty & errors in measurement & results:
Uncertainty & errors in measurement & results:
Uncertainty & errors in measurement & results:
Something to think about
1. Accuracy and precision
When marking titration results it is not unusual to come across something like this:
Titration of 25.00 cm3 of x mol dm-3 hydrochloric acid with a standardized solution of 1.00 mol dm-3 sodium hydroxide solution.
Average volume of 1.00 mol dm-3 NaOH(aq) required to titrate 25.00 cm3 of x mol dm-3 HCl(aq) = 25.00 cm3
The student then proceeds to calculate the unknown concentration of the hydrochloric acid as 1.00 mol dm-3 and work out the associated uncertainty by summing up the percentage uncertainties of the apparatus used to give an answer something like 1.00 ± 0.02 mol dm-3. They then think that they have listed all their uncertainties and applied them as they are supposed to do.
There is no awareness that the results achieved by the experimenter are poor and not precise. Titration is a reproducible procedure. If the burette and pipette are accurate to ± 0.10 cm3 and 0.05 cm3 respectively then the ‘accurate readings’ on the burette should be in agreement within ± 0.15 cm3. A difference of more than 0.15 cm3 in the accurate results suggests that the experimenter was not carrying out the procedure correctly. They should, in fact continue to repeat the titration until they do get agreement to within ± 0.15 cm3 for their ‘accurate’ results. Too often when evaluating an experiment students blindly follow the instructions on how to calculate uncertainties without applying or understanding the real assumptions made. Even if you do get reproducible accurate titration results you should also question whether the concentration of the ‘standardized’ sodium hydroxide solution made up by the teacher/technician (and therefore beyond your control) was exactly 1.00 mol dm-3. An example like this can be used to illustrate the importance of distinguishing between random errors and systematic errors. Repeating the titration several times will help to reduce random errors although none of the values should differ by more than ± 0.15 cm3. If the concentration of the sodium hydroxide solution was in fact 1.10 mol dm-3 then a systematic error of 10% will apply no matter how many titrations are completed or at least until the correct concentration of the standardized solution is used.
2. Determining the uncertainty associated with a reading
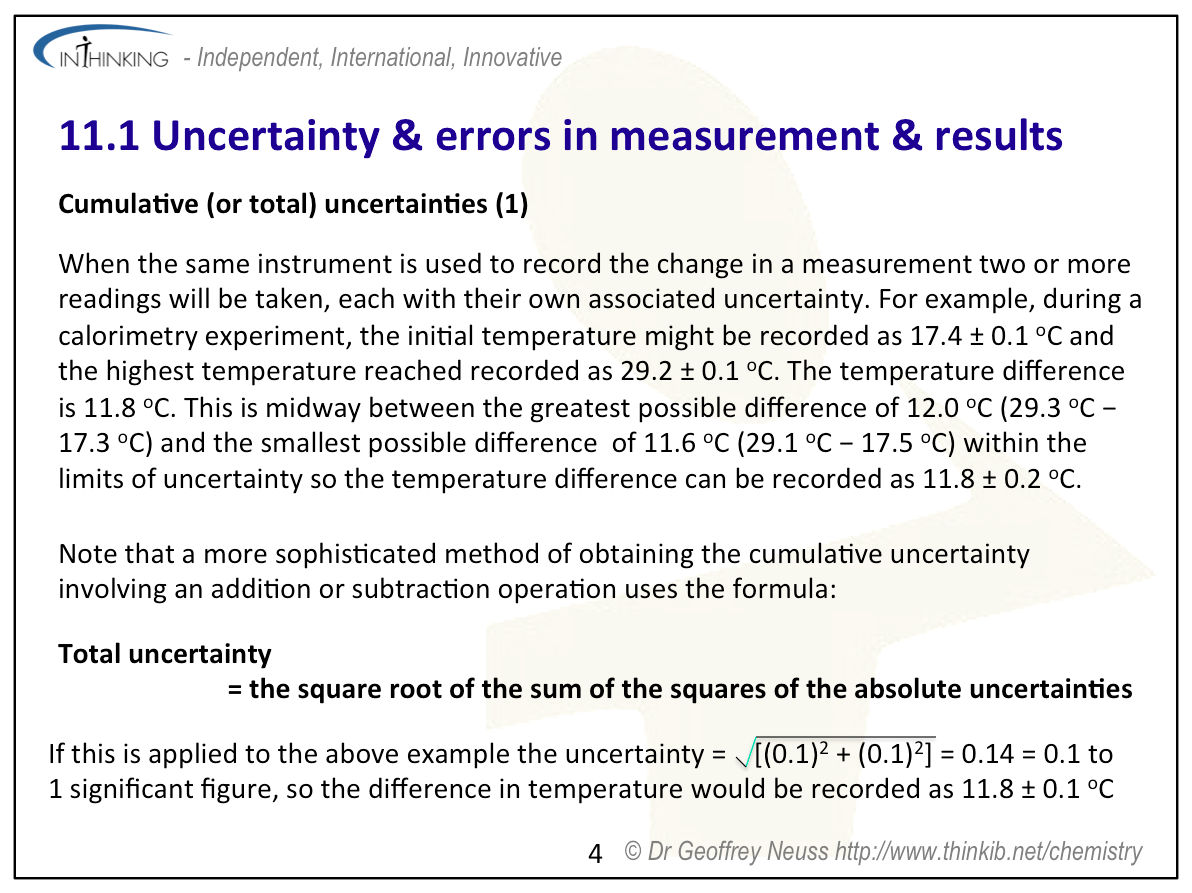
Consider using a 1 metre ruler with an uncertainty of ± 0.01 metre to measure a 2 metre length. Because the ruler would be needed to be used twice the length would be expressed as 2.00 ± 0.02 metres as the uncertainties are simply added. This is quite logical as the first measured value would lie between 0.99 and 1.01 m. The second value would be the same so when adding them together the value would lie between 1.98 and 2.02 m, i.e. 2.00 ± 0.02 m. Similarly if a thermometer accurate to ± 0.5 oC is used to measure a temperature difference then if the two readings were 19.1 oC and 26.9 oC the temperature difference should be recorded as 7.8 ± 1.0 oC as uncertainties are also added when the measured values are subtracted.
In fact, although seemingly logical and accepted by the IB, this is a simplified approach. A more sophisticated treatment uses the relationship:
The cumulative (or total) uncertainty = the square root of the sum of the squares of the absolute uncertainties.
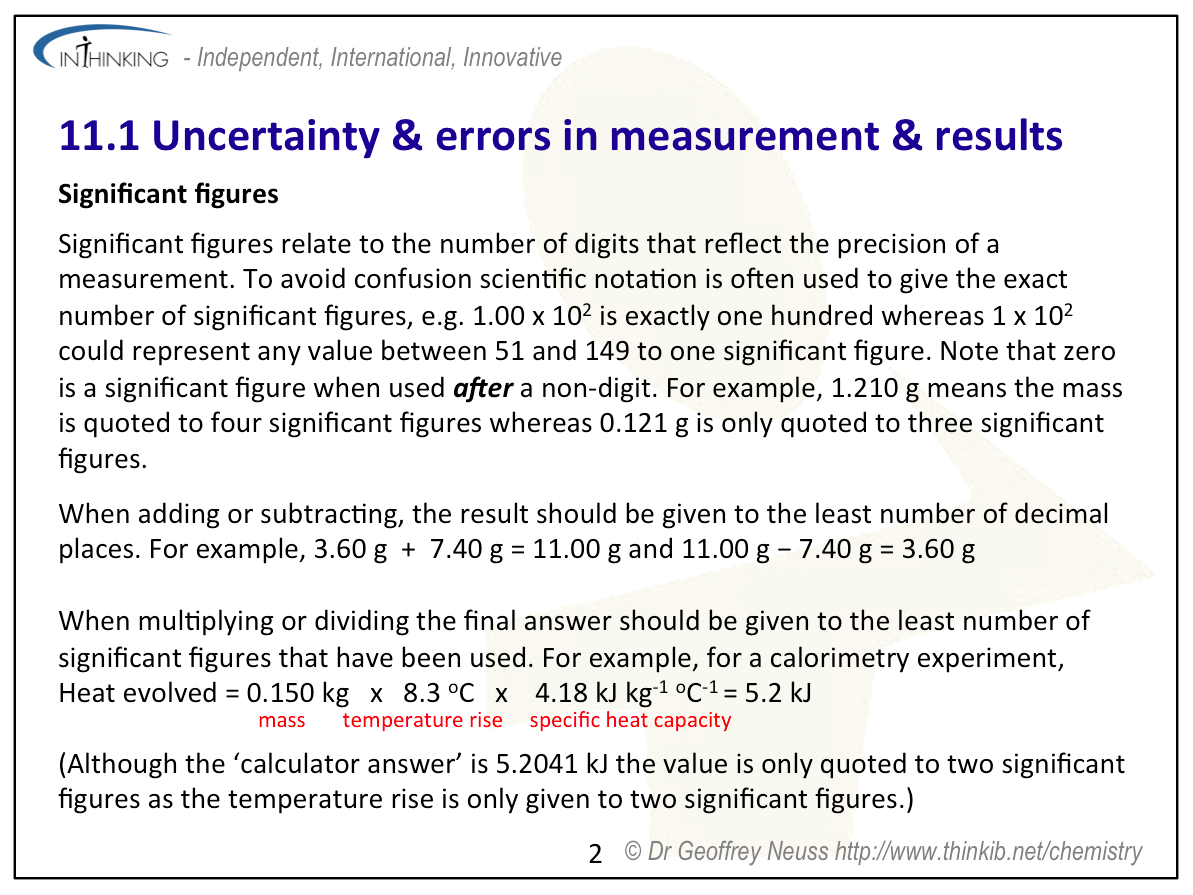
If this is applied to the metre ruler data above the cumulative uncertainty = √[(0.01)2 + (0.01)2] = 0.014 = 0.01 to one significant figure.
The IB generally wants to see an awareness of uncertainties rather than insisting on a particular approach and accepts any recognised method of calculation of cumulative uncertainties.
It is not quite so obvious when certain instruments are used even though technically two readings are taken. Consider measuring the mass of something using a balance accurate to ± 0.001 g. If the balance is reading zero and say an empty weighing bottle is placed on the balance then the mass of the weighing bottle might be recorded as 20.034 ± 0.001 g. If about ten grams of magnesium are placed in the weighing bottle and the new mass is 30.456 g then it would be usual to record the accurate mass of the magnesium as 10.422 ± 0.002 g. But is this really correct? When the balance was reading zero it is actually accurate to ± 0.001 g i.e. zero is a mass between - 0.001 and + 0.001 g so the mass of the weighing bottle should really be recorded as 20.034 ± 0.002 g and the mass of the magnesium, which is now the result of three separate readings, 10.422 ± 0.003 g. A sensible person will question whether this sort of pedantic attention to detail is really necessary. It isn't, but because of both studnets' and teacher's insecurity with how their IA marks are moderated it has almost become so. In fact instruments that rely on two readings for any measurement e.g. a balance or a burette state on them their uncertainty. A burette for example might say 50 cm3 accurate to 0.05 cm3 (see image on left - although it gives the units as ml rather than cm3). What many people take this to mean is that the uncertainty for the actual volume measured can be taken as ± 0.05 cm3 even though it has been arrived at by taking the difference between the final and initial readings so arguably should actually be quoted as ± 0.10 cm3. Luckily the IA moderators are told to accept either the actual uncertainty stated on the instrument (or the estimated uncertainty if no value is given) or double the uncertainty when moderating student's internal assessment work if the student reports it in their Individual Scientific Investigation.
Test your understanding of this topic
(Note that your teacher may have restricted your access to some or all of these questions and worked answers if they are going to use them as a class test or set them as an assignment.)
For ten 'quiz' multiple choice questions with the answers explained see MC test: Uncertainties & errors.
For short-answer questions see Uncertainty & error questions.
More resources
1. Stephanie Bell at the National Physics Laboratory has produced a really good guide entitled, "Beginners Guide to Uncertainty of Measurement" . An electronic version can be downloaded free.
2. Precision versus accuracy by The Chemistry Solution. It contains some useful information for answering multiple choice questions on this topic.
3. Uncertainty in measurements by lewischemistry.
4. Using significant figures by Brightstorm
5. Calculating overall uncertainties by Richard Thornley