Analysis of Cu(II) ions in solution
 Introduction
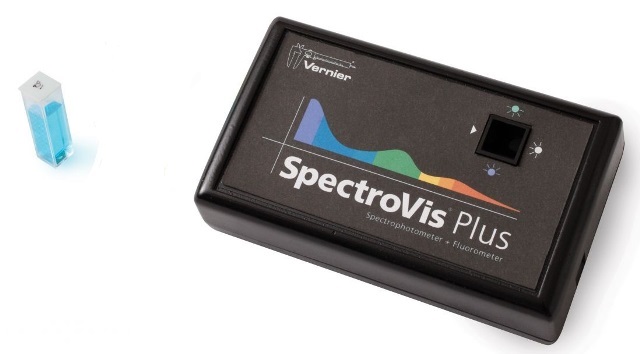
The use of a visible spectrophotometer is not specifically mentioned under the Mandatory laboratory components and in fact the Beer-Lambert Law only really needs to be taught if your Higher Level students are doing Option B : Biochemistry as it occurs in sub-topic B.7 Proteins & enzymes (AHL). However it is well worth making sure that your school laboratory has a visible spectrometer or at the very least a colorimeter if at all possible. It may be expensive to buy a spectrometer as such but if you can obtain a probe to connect to your data loggers, such as the Vernier SpectroVis plus (see below), it will help towards ticking the ICT boxes on the form 4/PSOW but more importantly your students can us it to do real research.

This experiment uses copper(II) sulfate solution to introduce students to the use of a visible spectrophotometer in order to determine an unknown concentration by constructing a calibration curve . The fact that it can be adapted to work with any substance that produces a coloured solution means that it is an excellent experiment to form part of the scaffolding to prepare students for their individual scientific investigation.
Teacher's notes
You may need to adapt the procedure given in the hand-out depending upon what type of spectrophotometer you have. It is certainly worth trialling it first with your own spectrophotometer before letting the students loose. The wavelength of 630 nm is not actually λmax (which has a value of approximately 810 nm) but has been chosen to give good readings for the concentrations used. It is best to provide a sample with an unknown concentration of approximately 0.100 mol dm-3 so it will lie somewhere in the middle of the calibration curve. This technique can usefully be twinned with the experiment to determine the percentage of copper in brass as it would provide two completely different practical ways of obtaining the same result. You could then ask the students to compare the advantages and disadvantages of the two methods. In fact a search of the Internet shows that there are several other ways in which the concentration of copper(II) ions in solution can be determined in a school laboratory.
 Student worksheet
TO DETERMINE THE CONCENTRATION OF COPPER(II) IONS IN A SOLUTION OF UNKNOWN CONCENTRATION
INTRODUCTION:
In this experiment you will construct a calibration curve and use it to find an unknown concentration by interpolation. Aqueous copper(II) ions are blue and the intensity of their colour in solution depends upon their concentration. A spectrophotometer measures the absorbance of light at different wavelengths. The absorbance (amount of light absorbed) is measured by comparing the logarithm of the initial intensity of the light, Io, with the logarithm of the intensity of the emerging light, I, after it has passed through the sample. Most spectrophotometers can be calibrated to measure the absorbance directly. The Beer-Lambert law, which is only true for dilute solutions, states:

ENVIRONMENTAL CARE:
All the waste should be placed in the marked ‘heavy metal ions’ in the fume cupboard and not poured down the sink.
SAFETY:
Copper(II) ions are poisonous. Wash your hands after handling the solutions and wear safety glasses.
PROCEDURE:
1. Preparation a standard solution of copper(II) sulfate. Calculate the molar mass of CuSO4.5H20 and work out the mass required to make 100.0 cm3 of 0.250 mol dm-3 solution. Using an analytical balance weigh out approximately this mass of hydrated copper(II) sulfate accurately. Record the mass. Dissolve it in about 50 cm3 of distilled water and transfer all the solution to a 100 cm3 volumetric flask. Add the washings to make sure all the copper(II) sulfate weighed out is transferred to the volumetric flask then make the total volume up to 100 cm3. Shake the flask to ensure it is thoroughly mixed. Use the mass you weighed out to calculate the exact concentration of this solution.
2. Preparation a dilute solutions of copper(II)sulfate of known concentrations. Using a 10.0 cm3 graduated pipette transfer exactly 8.0 cm3 of the copper(II) sulfate solution to a clean test-tube and add 2.0 cm3 of distilled water. Stopper the tube and shake. This new solution will have a concentration of approximately 2.00 x 10⁻¹ mol dm-3 but you will need to work out its exact concentration. Repeat this process by successively taking 6.0, 4.0, 2.0 and 1.0 cm3 of the copper(II) sulfate solution and adding the exact quantity of distilled water to make the total volume up to 10.0 cm3 each time. Label each tube with its exact concentration.
3. Measuring the absorbance and preparing the calibration curve. Set the spectrophotometer to measure the wavelength at 630 nm. Transfer each solution in turn to the cuvette and record its absorbance at 630 nm. Wash the cuvette after each use, first with distilled water then rinse twice with some of the next solution to be used before refilling the cuvette with the new solution. Either use software, or mIB Docs (2) Teamally to plot a graph of absorbance against concentration.
4. Determining the unknown concentration. Repeat the procedure with the sample of unknown concentration you have been provided with to measure its absorbance using the same cuvette under the same conditions. Interpolate the graph to find its concentration.
QUESTIONS:
1. Discuss the major sources of possible error in this experiment.
2. Describe exactly what you would do if the absorbance of the unknown sample was too high to fit comfortably on the graph.
This worksheet can also be downloaded from:

 IB Docs (2) Team