 IB Docs (2) Team
 Determination of an organic structure
Structural determination using primary & secondary data

 Introduction
This practical exercise does not form part of the mandatory laboratory components but perhaps it should. Students are supposed to cover five different types of ICT during the practical scheme of work but there is little emphasis on them gaining practical skills in chemistry techniques. This practical involves reflux, filtration under reduced pressure, recrystallisation, determination of melting points and thin layer chromatography. It was devised by my colleague Dr John Devonshire for the 2001 programme when we both worked at Atlantic College and now it can be brought back to cover Topic 11.3 Spectroscopic identification of organic compounds.
The practical nicely merges primary and secondary data, i.e. 'hands on' and 'hands off' and could form a useful part of the 'Scaffolding' for the Individual Scientific Investigation. Essentially students hydrolyse an ester using sodium hydroxide. They separate the two products and recrystallise the organic acid so that they can help to identify it by performing a melting point determination. They also test its purity by thin layer chromatography. Although they do not isolate the alcohol, they perform a test with acidified potassium dichromate(VI) to see whether it can be oxidised. The percentage compositions of the ester and the acid and alcohol it forms after hydrolysis are given together with relevant spectral data for the students to interpret. Two different esters are used which are given the names MS and EB . This should give you a strong clue as to what they are!

 Student worksheet
DETERMINATION OF AN ORGANIC STRUCTURE
Choose one of the two substances labelled MS and EB that are provided. A certain amount of analytical data is given for each and you should use this information to find out as much as possible about the structure of the compound you have chosen.
You will then react your compound with sodium hydroxide solution following the procedure given below. Two organic compounds are formed. One of these can be isolated and the other may be detectable by chemical means, but will not be isolated. Analytical information for these two compounds is also given.
At the end of the experiment gather together all the information that you have collected and deduce as much as you can about the structures of the starting material and products that you have been associated with.
ENVIRONMENTAL CARE:
The chemicals used present no serious risk to the environment.
SAFETY: Hot sodium hydroxide solution is damaging to the eyes. Safety glasses must be worn.
PROCEDURE:
Weigh 2.0 g of the substance (MS or EB) into a 50 cm3 round bottom flask and add 10 cm3 of 2.0 mol dm-3 NaOH(aq) solution. Add a few anti-bumping grIB Docs (2) Teamles and gently reflux the mixture for 30 minutes. After cooling pour the mixture into a small beaker and add dilute sulfuric acid solution with stirring until the solution is definitely acidic. A solid should form. Filter the solid using a Buchner flask and water pump. Wash the solid with a little distilled water. Keep both the solid and the aqueous filtrate.
Transfer the solid (call it MS-1 or EB-1) to a 50 cm3 conical flask, add about 20 cm3 of distilled water and bring to the boil. The solid should dissolve, although if some remains, add a little ore water until it does all dissolve. Set aside to cool slowly and a crop of good crystals should form. Filter these and transfer them to a previously weighed watch glass and leave to dry overnight in the air. Weigh again when the crystals are dry and then take the melting point of the pure dried product. Check the purity by thin-layer chromatography using a silica-coated plate with ethanol as the eluent (solvent). A UV lamp may be used to detect the spots.
The filtrate from the initial experiment contains another compound (call it MS-2 or EB-2) which will not be isolated but which may be detectable. Add 10 cm3 of potassium dichromate(VI) solution to the filtrate and warm gently. Observe any colour changes that occur.
REPORT
Using the data gathered from your own experiments and the data provided below summarise this extensive experiment into a formal report. In your report record all the relevant information and give as much information as you can upon the identities of all the three compounds and on the reactions taking place.
ANALYTICAL INFORMATION FOR MS AND EB
Compound MS. Elemental analysis: 63.16% C, 5.26% H, 31.58% O. Mass spectrum: molecular ion at 152 and fragments at 151, 137, 121, 93, 76, 59, 31 and 15. IR absorptions at 2900, 1700 (strong), 1650 and 1200 cm-1. 1H NMR signals at 3.8 ppm (integration trace 3 units), 7.0 ppm (integration trace 1 unit) and 7.3 ppm (integration trace 4 units).
Compound EB. Elemental analysis: 72.00% C, 6.67% H, 21.33% O. Mass spectrum: molecular ion at 150 and fragments at 121, 177, 45 and 29. IR absorptions at 2900, 1700 (strong), 1650 and 1200 cm-1. 1H NMR signals at 0.9 ppm (integration trace 3 units), 3.6 ppm (integration trace 2 units) and 7.3 ppm (integration trace 5 units).
ANALYTICAL INFORMATION FOR MS-1 and EB-1
Compound MS-1. Elemental analysis: 60.87% C, 4.35% H, 34.78 O Mass spectrum: molecular ion at 138 and fragments at 137, 121, 93, 76, 45 and 17. IR peaks at 3290 (broad), 2900, 2700, 1710 (strong), 1650 and 1200 cm-1. 1H NMR: signals at 7.0 (integration trace 1 unit), 7.3 (integration trace 4 units) and 11.5 ppm (integration trace 1 unit).
Compound EB-1. Elemental analysis: 68.85% C, 4.92% H, 26.23 O. Mass spectrum: molecular ion at 122 and fragments at 121, 105, 77, 45 and 17. IR peaks at 3290 (broad), 2900, 2700, 1710 (strong), 1650 and 1200 cm-1. 1H NMR: signals at 7.3 (integration trace 5 units) and 11.5 ppm (integration trace 1 unit).
ANALYTICAL INFORMATION FOR MS-2 and EB-2
Compound MS-2. Elemental analysis: 37.50% C, 12.50% H, 50.00 O Mass spectrum: molecular ion at 32 and fragments at 31, 17 and 15. IR spectrum given below. 1H NMR: signals at 3.8 (integration trace 3 units) and 4.5 ppm (integration trace 1 unit).
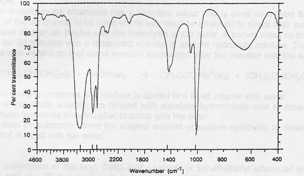
Infrared spectrum of compound MS-2
Compound EB-2. Elemental analysis: 52.17% C, 13.04% H, 34.79 O. Mass spectrum: molecular ion at 46 and fragments at 45, 29 and 17. IR spectrum given below. 1H NMR: signals at 0.9 (integration trace 3 units), 3.6 (integration trace 2 units) and 4.5 ppm (integration trace 1 unit).
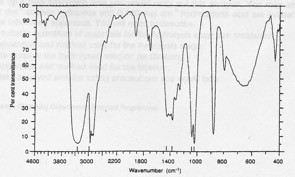
Infrared spectrum of compound EB-2
This worksheet can also be downloaded from:
 Twitter
 Facebook
 LinkedIn