Spectroscopic identification of organic compounds
.jpg)

 11.3 Spectroscopic identification of organic compounds (6 hours)
Pause for thought
Spectroscopy (1H NMR, mass spectrometry and IR) was part of the core/AHL for the IB programme that was examined from 2003 – 2008 but was removed from the core/AHL for the last programme examined from 2009 – 2015. I’m pleased that spectroscopy has now returned to the core/AHL. It is relevant to students who are not progressing further with science after they complete their Diploma, as they will often come across references to it throughout their lives. These may include newspaper articles on the latest athlete to fail a drug test (below left) or a forensic report in a sensational murder trial or more mundanely when they go into hospital themselves for an MRI scan (below right). For the student who is going on to university to study a science or a science-based subject modern analytical chemistry features highly in the study of many different disciplines. The knowledge gained in this sub-topic will also be used in each of the four options.

The treatment of 1H NMR, IR and mass spectrometry is relatively simple for the diploma programme with the emphasis on their use to elucidate structures. No operating techniques are required for this sub-topic. It does however appeal to many students as they can use analysis and derive intellectual satisfaction by solving problems that rely on the data from several different analytical sources. Students should also be encouraged to look at problems the ‘other way round’ by predicting what the spectra of a particular compound will look like.
There is one disadvantage when teaching this sub-topic. Most school laboratories will not have their own 1H NMR. IR or mass spectrometer (there are exceptions!). However not all practical work needs to be ‘hands on’ so it is good to get students to visit the chemistry department of the local university or the research laboratories of a nearby company such as a pharmaceutical firm to see the instruments in operation. There are also good videos, many produced by the Royal Society of Chemistry, that cover most, if not all, of the important concepts although they do tend to overemphasise the operating techniques. Since there is a wealth of spectroscopic data this sub-topic may also generate ideas for the Individual Scientific Investigation.
Nature of science
Identification and the determination of structure have become routine due to improvements in the instrumentation involved in mass spectrometry, proton nuclear magnetic resonance and infrared spectroscopy.
Models have been developed in order to explain some phenomena, e.g. spectra based on the model of bond vibrations, that may not be observable.
Learning outcomes
After studying this topic students should be able to:
Understand:
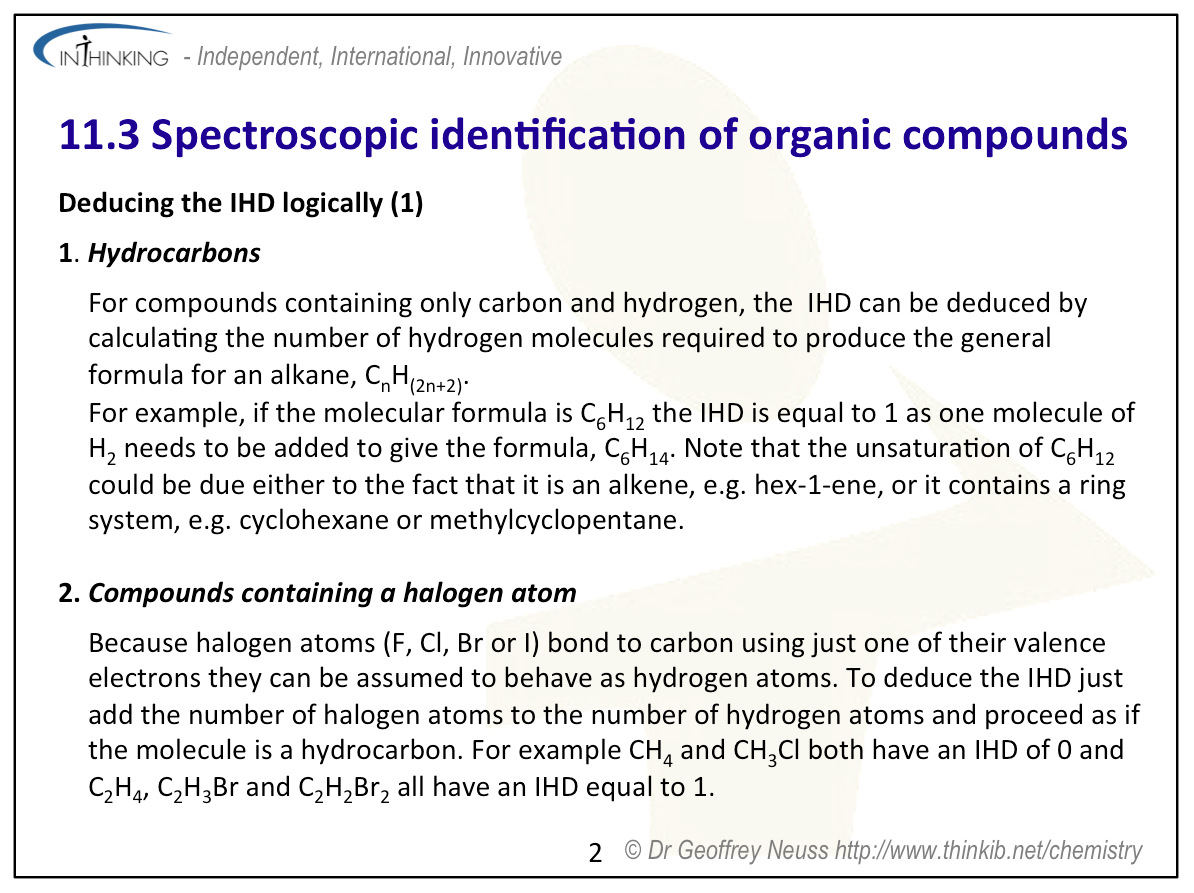
- The index of hydrogen deficiency, IHD, otherwise known as the degree of unsaturation. It can be used to determine the number of rings or multiple bonds in a molecule from its molecular formula.
- Techniques that can be used to identify compounds and to determine their structure include mass spectrometry, MS, proton nuclear magnetic resonance spectroscopy, 1H NMR, and infrared spectroscopy, IR.
Apply their knowledge to:
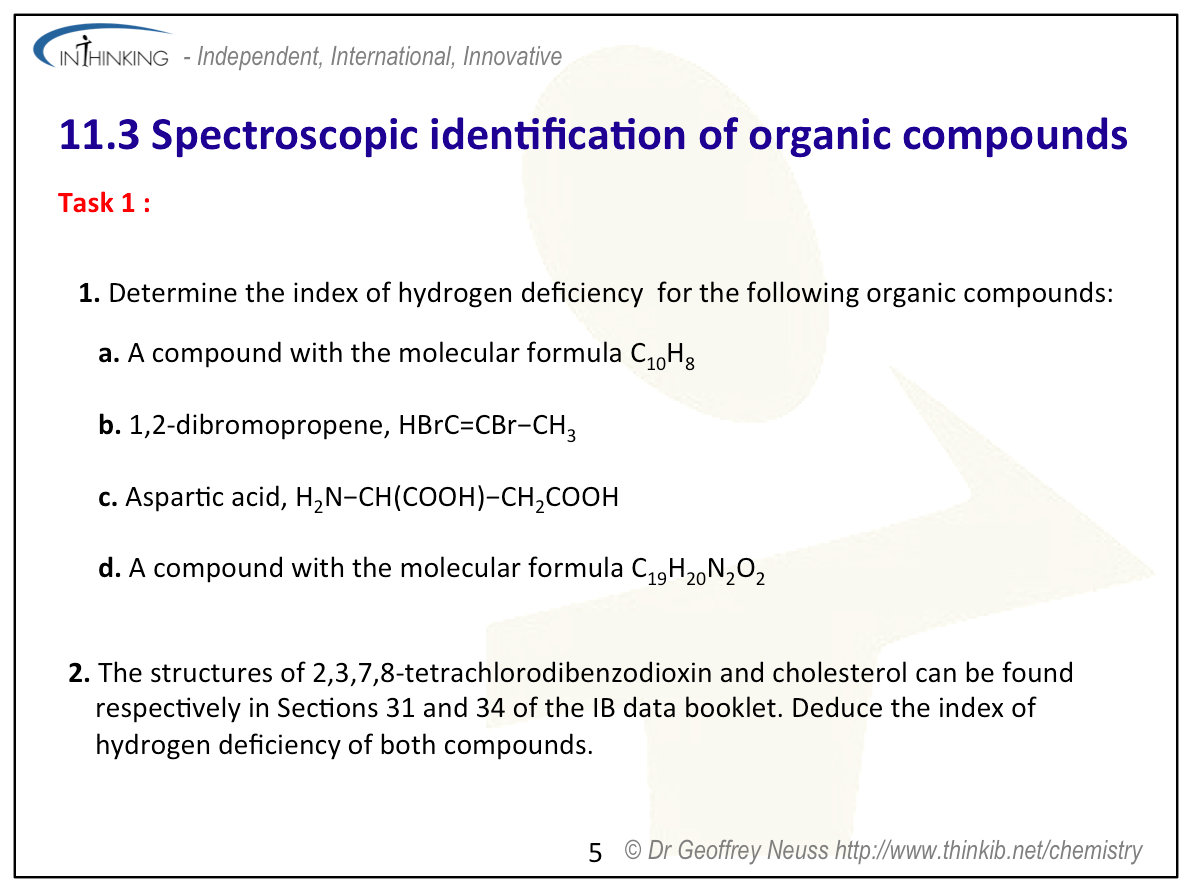
- Determine the IHD from a molecular formula.
- Deduce information about the structural features of a compound from its percentage composition, MS, 1H NMR or IR.
Clarification notes
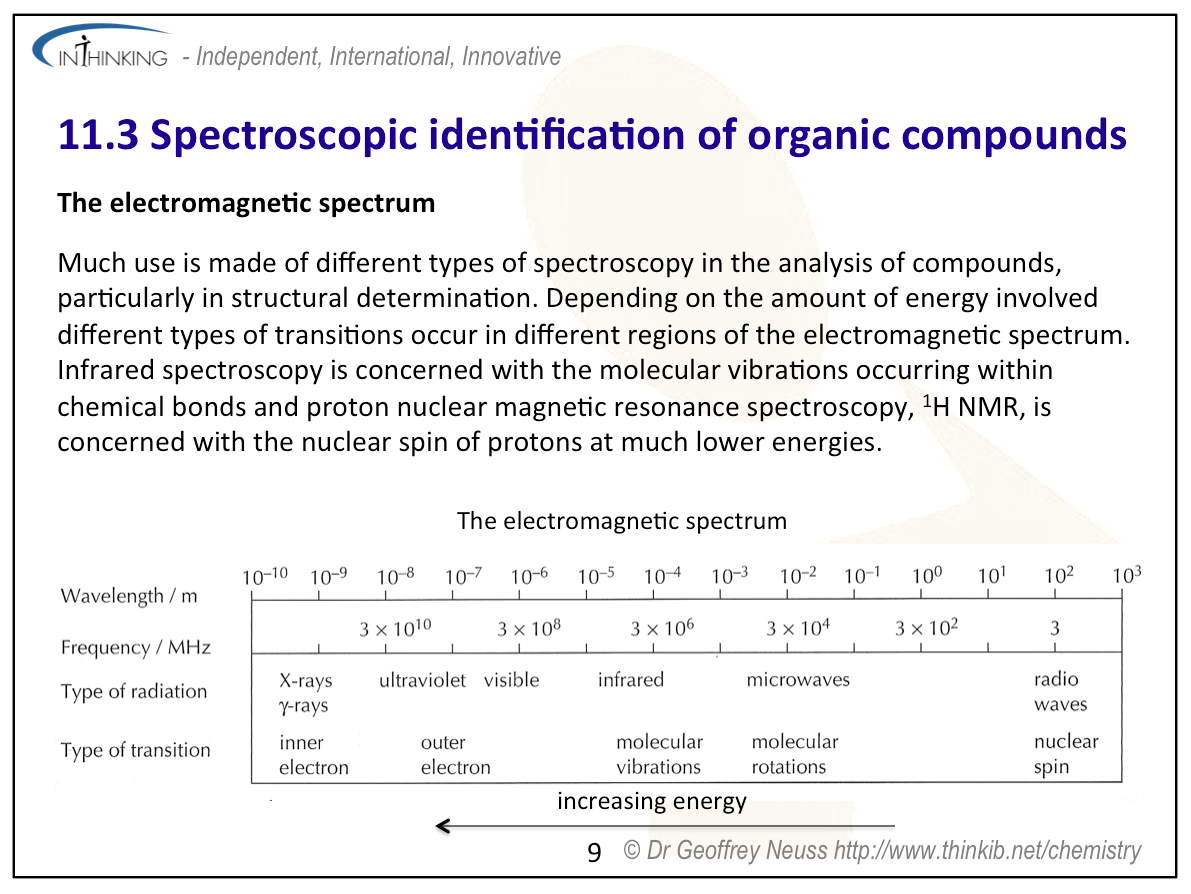
The electromagnetic spectrum, EMS, can be found in Section 3 of the data booklet.
The regions of the EMS applicable to each technique should be understood.
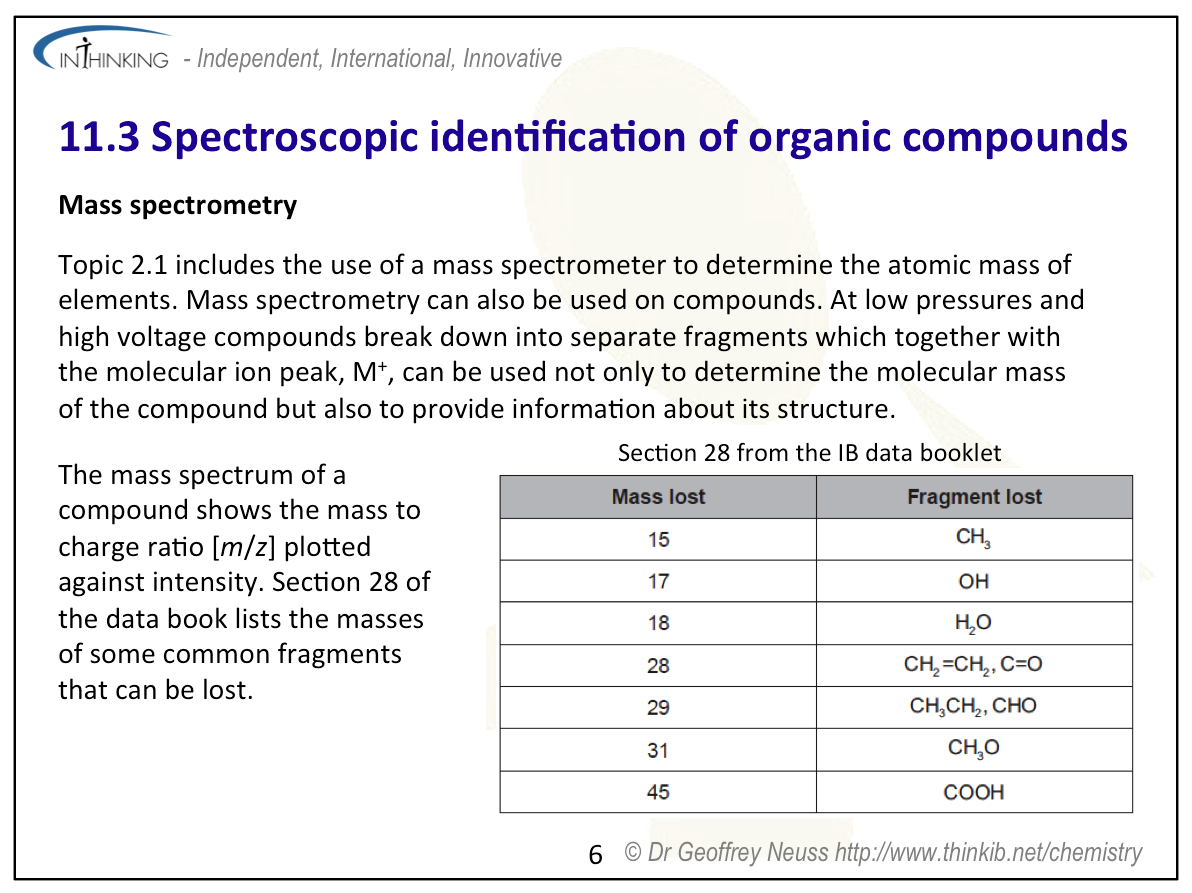
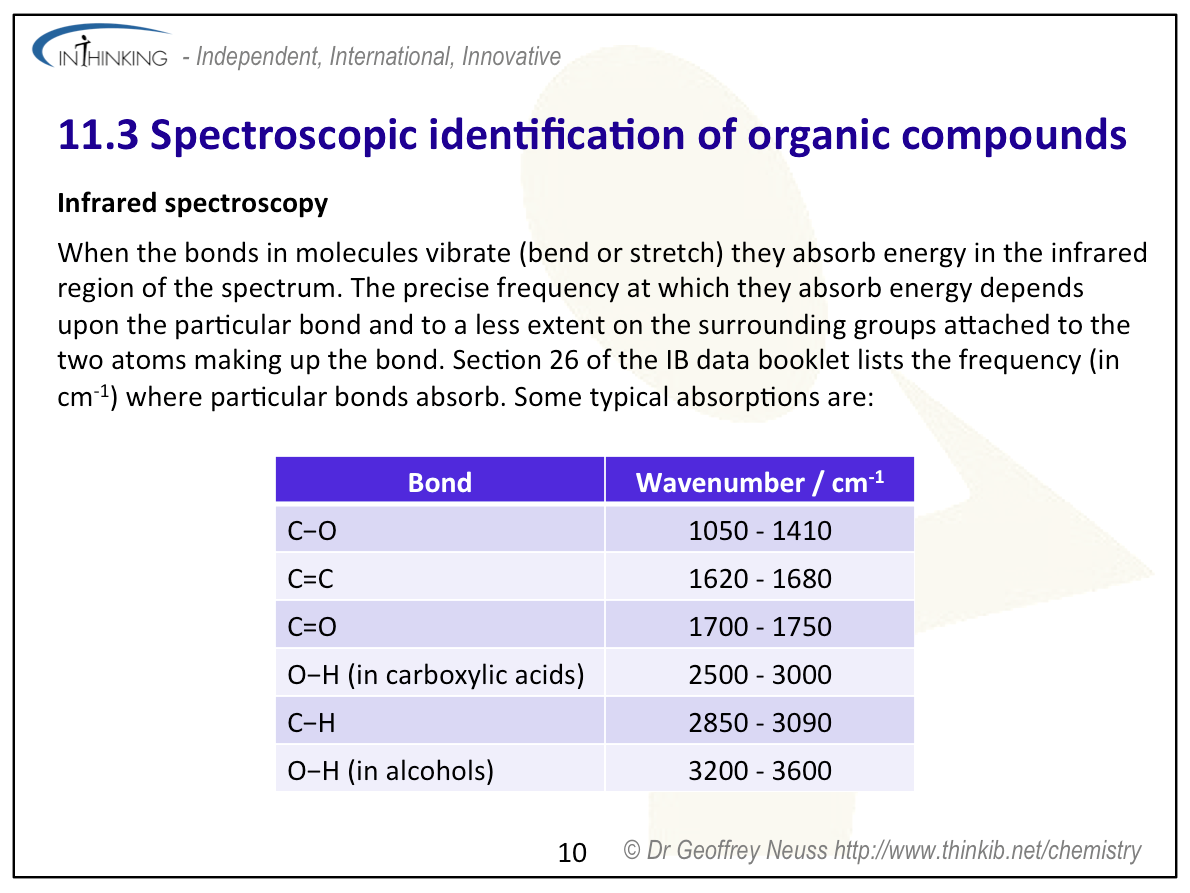
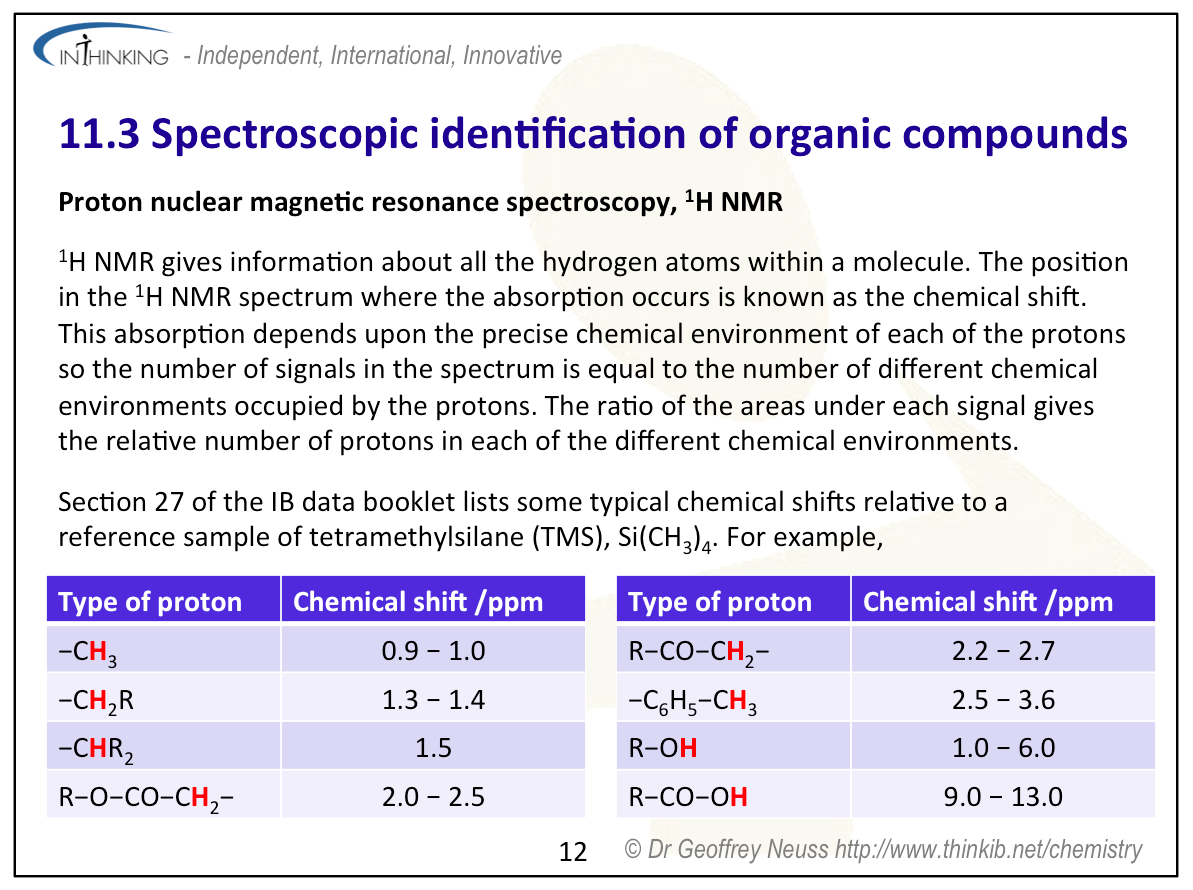
The operating principles are not required for any of these spectroscopic method. The characteristic ranges for IR absorptions (Section 26), 1H NMR signals (Section 27) and specific MS fragments (Section 28) can be found in the data booklet.
For 1H NMR, only the ability to deduce the number of different hydrogen (proton) environments and the relative numbers of hydrogen atoms in each environment
is required. Splitting patterns are not required but integration traces should be covered.
International-mindedness
Scientists from different countries continually collaborate to monitor and analyse the presence and amounts of toxins and xenobiotics in the environment using spectroscopic techniques.
Teaching tips
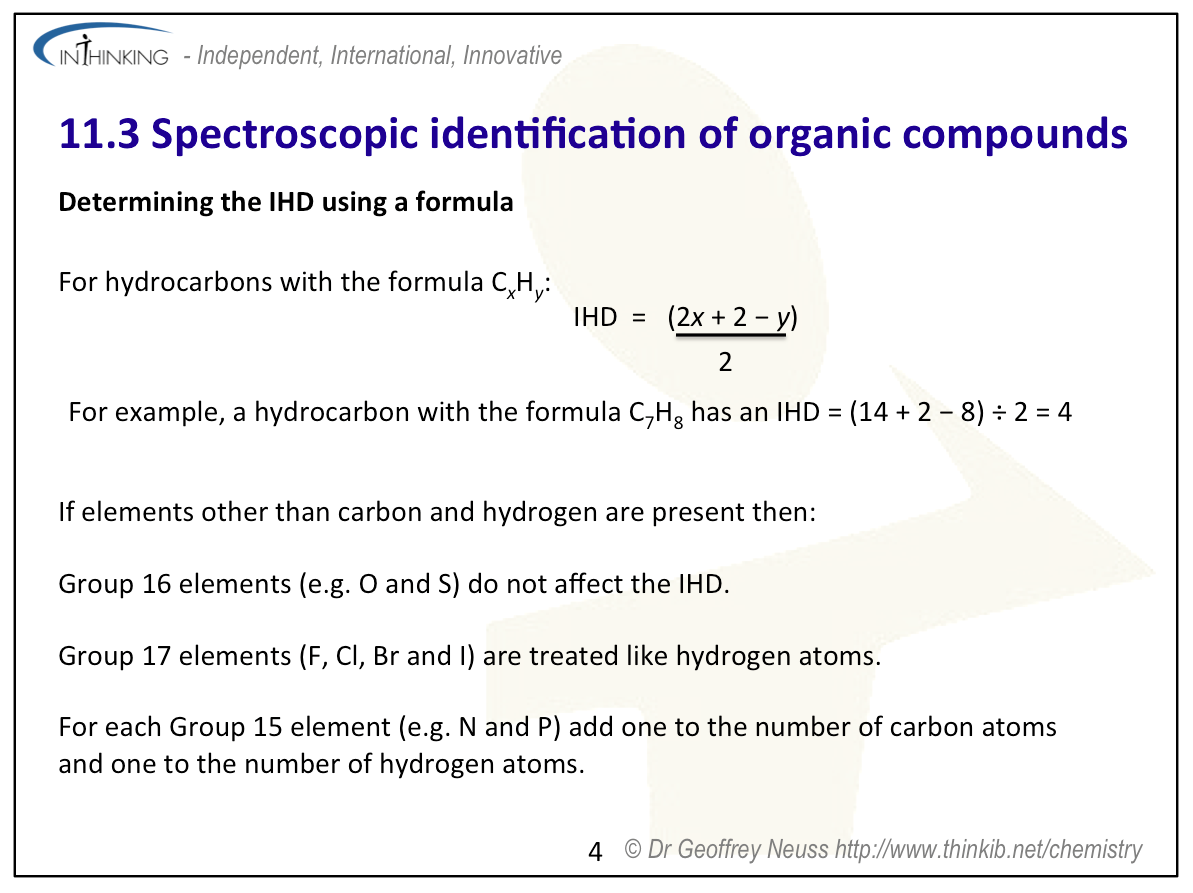
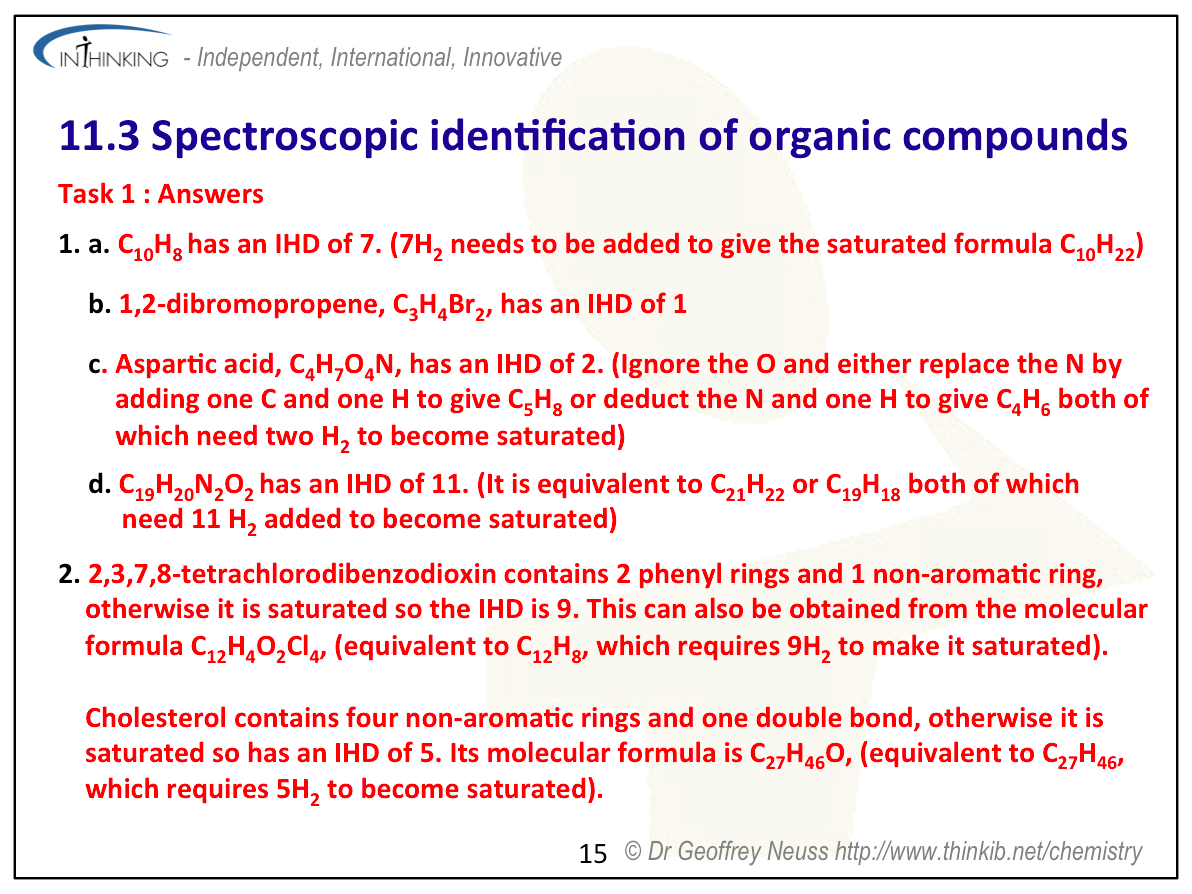
It probably makes sense to cover the index of hydrogen deficiency first as it is a rather stand alone concept compared to the rest of the sub-topic. Basically the hydrogen content falls as the number of double and triple bonds increases or the compound is cyclic (although cyclic compounds feature very little on this programme). Once students understand the basic idea then they can use the formula:
IHD = ½ x (2x + 2 - y) where x = the number of carbon atoms and y = the number of hydrogen atoms.
You will also need to cover how other common atoms such as O, S, halides and N are treated.
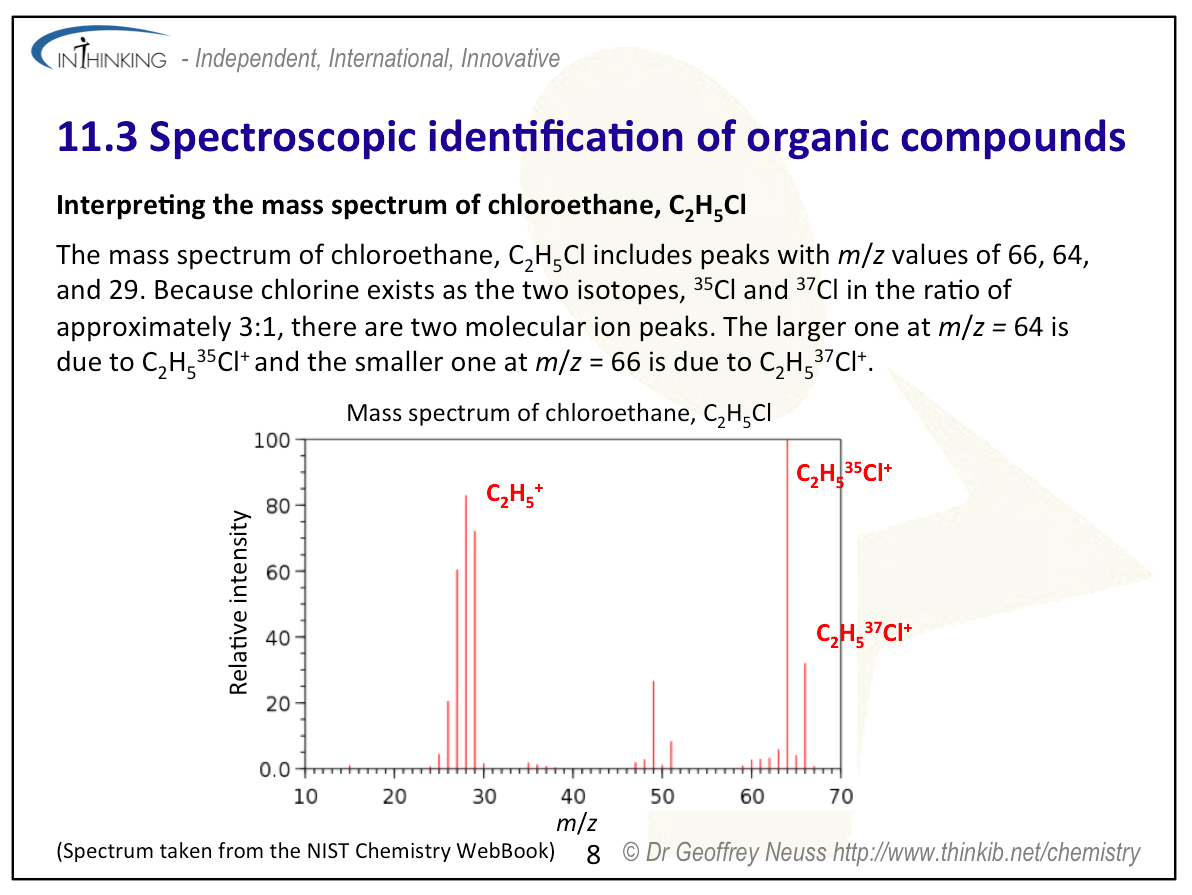
Students will already have some understanding of mass spectrometry from Topic 2.1 The nuclear atom. You will need to emphasise the importance of the molecular ion peak and the fact that fragments of organic molecules also give peaks.
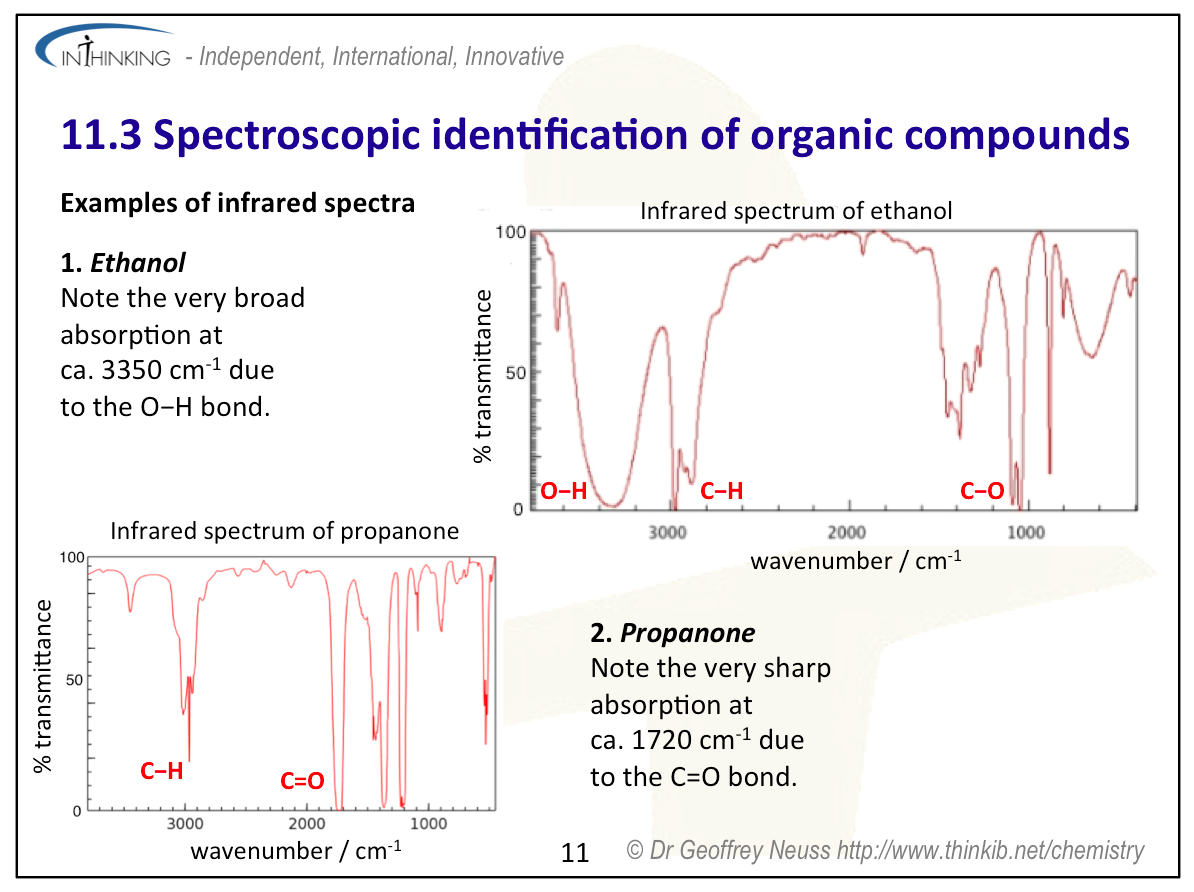
Refer to the electromagnetic spectrum to explain that infrared spectroscopy is due to bond vibrations whereas 1H NMR involves much lower energy in the radio region as it concerns nuclear spin. This is why MRI is virtually completely harmless compared to X-rays. At this level students need to see a few IR spectra and realise that only certain functional groups are easy to assign using the data booklet (e.g. −OH and C=O). It is worth mentioning the finger print region, which is unique to each compound, although students are not expected to use it.
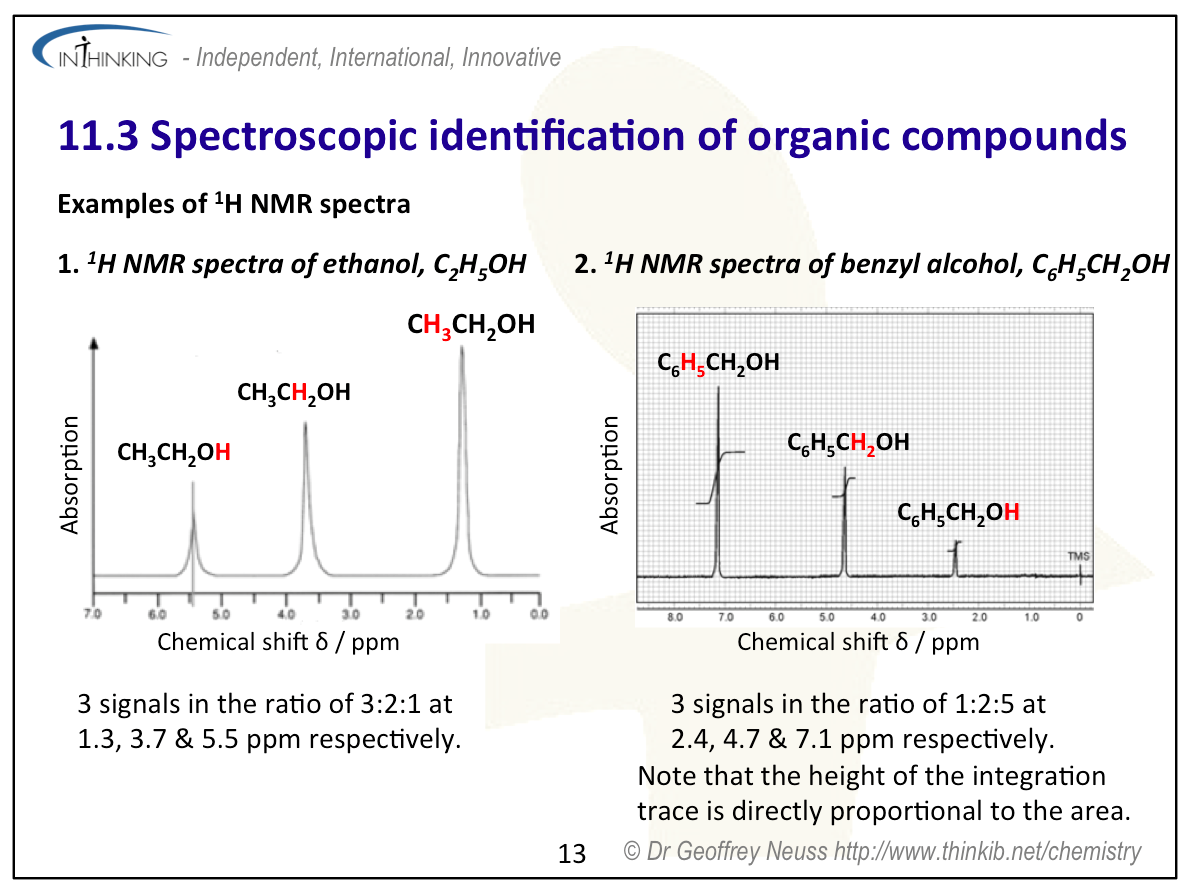
For 1H NMR place more emphasis on the importance of the number of signals and the area under each signal than on the chemical shift as this can vary according to solvent. Use examples such as the isomers of butane or pentane to show how the number of signals and their integration trace can be helpful in elucidating structure.
Finally get them to work through the attached examples of how these three techniques can be combined to unambiguously determine the structure of an organic compound once its empirical formula is known.
Study guide
Pages 101 - 106
Questions
For ten 'quiz' multiple choice questions with the answers explained see MC test: Spectroscopic identification of organic compounds.
For short-answer questions together with the worked answers. on IHD see Index of hydrogen deficiency questions
For ten short-answer questions on identification of individual compounds from spectral data together with their worked answers see:
Identification from spectra: Question 1,
Identification from spectra: Question 2,
Identification from spectra: Question 3,
Identification from spectra: Question 4,
Identification from spectra: Question 5.
Identification from spectra: Question 6.
Identification from spectra: Question 7.
Identification from spectra: Question 8.
Identification from spectra: Question 9.
Identification from spectra: Question 10.
Vocabulary list
degree of unsaturation
index of hydrogen deficiency, IHD
molecular ion
fragment
wavenumber
fingerprint region
proton nuclear magnetic resonance spectroscopy,1HNMR
signal
integration trace
IM, TOK, 'Utilization' etc.
See separate page which covers all of Topic 11.
Practical work
Visit a chemistry research laboratory at the local university (or at a nearby industry).
Teaching slides
You can use this slide gallery for learning or for reviewing concepts and information. It covers all the key points in the syllabus for this sub-topic.
Spectroscopic identification of organic compounds:
Spectroscopic identification of organic compounds:
Spectroscopic identification of organic compounds:
Spectroscopic identification of organic compounds:
Spectroscopic identification of organic compounds:
Spectroscopic identification of organic compounds:
Spectroscopic identification of organic compounds:
Spectroscopic identification of organic compounds:
Spectroscopic identification of organic compounds:
Spectroscopic identification of organic compounds:
Spectroscopic identification of organic compounds:
Spectroscopic identification of organic compounds:
Spectroscopic identification of organic compounds:
Spectroscopic identification of organic compounds:
Spectroscopic identification of organic compounds:
Spectroscopic identification of organic compounds:
Other resources
1. Infrared spectrum of ethanol, CH3CH2OH (to show broad -OH absorption and % transmittance and wavenumber axes)
2. Infrared spectrum of butanone, CH3COCH2CH3 (to show a typical carbonyl absorption at about 1720 cm−1)
3. The 1H NMR spectrum of ethanol, CH3CH2OH. You will need to tell Standard Level students to Ignore the splitting. Note that the shift for the -OH proton occurs at 4.8 ppm. Section 27 of the IB data booklet lists it as occurring anywhere between 1.0 and 6.0 ppm..
4. Mass spectrum of ethyl ethanoate, CH3COOC2H5. Note the very small (M+1)+ peak at m/z = 89 due to the presence of 13C. See how many of the fragments your students (and you!) can identify.