Uncertainty & errors

 11.1 Uncertainty & errors in measurement & results (2 hours)
Pause for thought
1. Accuracy and precision
When marking titration results it is not unusual to come across something like this:
Titration of 25.00 cm3 of x mol dm-3 hydrochloric acid with a standardized solution of 1.00 mol dm-3 sodium hydroxide solution.
Average volume of 1.00 mol dm-3 NaOH(aq) required to titrate 25.00 cm3 of x mol dm-3 HCl(aq) = 25.00 cm3
The student then proceeds to calculate the unknown concentration of the hydrochloric acid as 1.00 mol dm-3 and work out the associated uncertainty by summing up the percentage uncertainties of the apparatus used to give an answer something like 1.00 ± 0.02 mol dm-3. They then think that they have listed all their uncertainties and applied them as they are supposed to do.
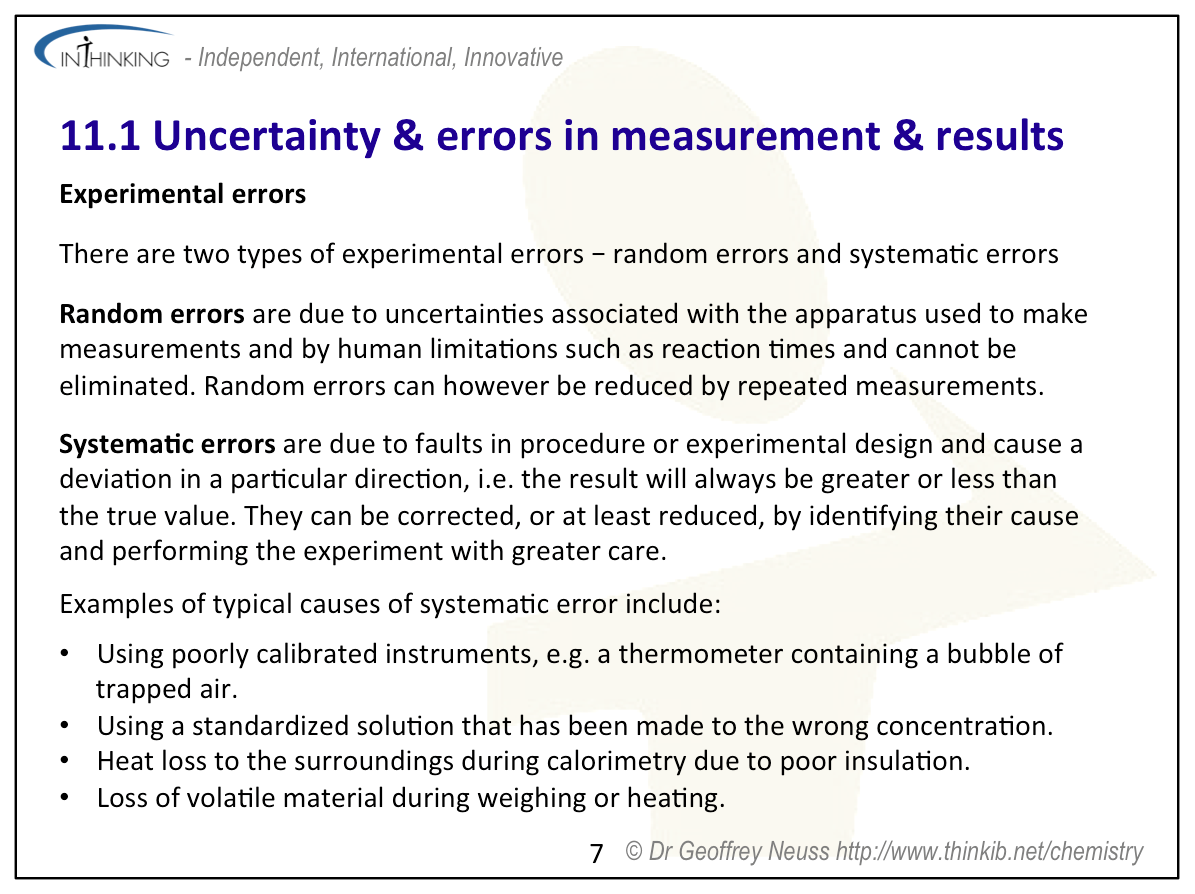
There is no awareness that the results achieved by the experimenter are poor and not precise. Titration is a reproducible procedure. If the burette and pipette are accurate to ± 0.10 cm3 and 0.05 cm3 respectively then the ‘accurate readings’ on the burette should be in agreement within ± 0.15 cm3. A difference of more than 0.15 cm3 in the accurate results suggests that the experimenter was not carrying out the procedure correctly. They should, in fact continue to repeat the titration until they do get agreement to within ± 0.15 cm3 for their ‘accurate’ results. Too often when evaluating an experiment students blindly follow the instructions on how to calculate uncertainties without applying or understanding the real assumptions made. Even if they do get reproducible accurate titration results they should also question whether the concentration of the ‘standardized’ sodium hydroxide solution made up by the teacher/technician (and therefore beyond their control) was exactly 1.00 mol dm-3. An example like this can be used to illustrate the importance of distinguishing between random errors and systematic errors. Repeating the titration several times will help to reduce random errors although none of the values should differ by more than ± 0.15 cm3. If the concentration of the sodium hydroxide solution was in fact 1.10 mol dm-3 then a systematic error of 10% will apply no matter how many titrations are completed or at least until the correct concentration of the standardized solution is used.
2. Determining the uncertainty associated with a reading
Consider using a 1 metre ruler with an uncertainty of ± 0.01 metre to measure a 2 metre length. Because the ruler would be needed to be used twice the length would be expressed as 2.00 ± 0.02 metres as the uncertainties are simply added. This is quite logical as the first measured value would lie between 0.99 and 1.01 m. The second value would be the same so when adding them together the value would lie between 1.98 and 2.02 m, i.e. 2.00 ± 0.02 m. Similarly if a thermometer accurate to ± 0.5 oC is used to measure a temperature difference then if the two readings were 19.1 oC and 26.9 oC the temperature difference should be recorded as 7.8 ± 1.0 oC as uncertainties are also added when the measured values are subtracted.
In fact, although seemingly logical, this is a simplified approach. A more sophisticated treatment uses the relationship:
The cumulative (or total) uncertainty = the square root of the sum of the squares of the absolute uncertainties.
If this is applied to the metre ruler data above the cumulative uncertainty = √[(0.01)2 + (0.01)2] = 0.014 = 0.01 to one significant figure.
The IB generally wants to see an awareness of uncertainties rather than insisting on a particular approach and accepts any recognised method of calculation of cumulative uncertainties.
It is not quite so obvious when certain instruments are used even though technically two readings are taken. Consider measuring the mass of something using a balance accurate to ± 0.001 g. If the balance is reading zero and say an empty weighing bottle is placed on the balance then the mass of the weighing bottle might be recorded as 20.034 ± 0.001 g. If about ten grams of magnesium are placed in the weighing bottle and the new mass is 30.456 g then it would be usual to record the accurate mass of the magnesium as 10.422 ± 0.002 g. But is this really correct? When the balance was reading zero it is actually accurate to ± 0.001 g i.e. zero is a mass between - 0.001 and + 0.001 g so the mass of the weighing bottle should really be recorded as 20.034 ± 0.002 g and the mass of the magnesium, which is now the result of three separate readings, 10.422 ± 0.003 g. A sensible person will question whether this sort of pedantic attention to detail is really necessary. It isn't, but because of teacher's insecurity with how their IA marks are moderated it has almost become so. In fact instruments that rely on two readings for any measurement e.g. a balance or a burette state on them their uncertainty. A burette for example might say 50 cm3 accurate to 0.05 cm3 (see image on left - although it gives the units as ml rather than cm3). What many people take this to mean is that the uncertainty for the actual volume measured can be taken as ± 0.05 cm3 even though it has been arrived at by taking the difference between the final and initial readings so arguably should actually be quoted as ± 0.10 cm3. Luckily the IA moderators are told to accept either the actual uncertainty stated on the instrument (or the estimated uncertainty if no value is given) or double the uncertainty when moderating student's internal assessment work if the student reports it in their Individual Scientific Investigation.
Nature of Science
Replication of quantitative measurements is crucial to ensure reliability—precision, accuracy, systematic, and random errors can only be interpreted properly through replication.
Learning outcomesAfter studying this topic students should be able to: Understand:
Apply their knowledge to:
| Clarification notesThe number of significant figures given in a result is based on the figures given in the data. International-mindednessThe International Standards Organization (ISO) published the Guide to the Expression of Uncertainty in Measurement in 1995. This was a result of seven international organizations, including IUPAC, collaborating together. It has been translated into several different languages and has been widely adopted in most countries. |
Teaching tipsProbably the two most important concepts for students to understand are distinguishing between accurate and precise and also distinguishing between random and systematic. The dartboard analogy is good for accurate and precise. The darts may all land very close together to illustrate precise but if they are far from the bull's eye they are not very accurate. It is probably best to teach this sub-topic when students are actually doing a practical which requires it as they can then put it into context. A good experiment is the acid-base titrations practical. This is good as it involves the uncertainties associated with a burette, a pipette, a volumetric flask and a balance. To calculate the overall uncertainty the students will need to work out the percentage uncertainty associated with each instrument and then add these together to get the total percentage uncertainty. Finally they will need to restate this as the actual uncertainty associated with the value they have obtained for the molar mass of the hydrated oxalic acid crystals. It is worth pointing out other uncertainties and assumptions made even if they cannot quantify these. For example, how pure is the oxalic acid, was all the mass of the oxalic acid weighed out transferred to the volumetric flask and how accurately did the technician make up the standard solution of hydroxide solution? Impress upon students that many instruments they use, such as electronic balances, pipettes, volumetric flasks and pipettes do in fact have very low uncertainties. The real uncertainties in their results will more likely be due to impure chemicals, incomplete reactions, heat loss, failure to keep controlled variables controlled or wrongly stated concentrations. Probably the most common instrument they will use for accurate work that has the greatest degree of uncertainty is a thermometer. Often these can only be read to half a degree and the uncertainty is often quoted as ± 0.5 oC. If the thermometer is being used to measure a 10 oC difference in temperature then the uncertainty from the two reading is ± 1.0 oC which leads to an uncertainty of ten per cent. It is here that temperature probes connected to a data logger can significantly reduce the amount of uncertainty. It may be worth pointing out that an inaccurate thermometer (i.e. one that is wrongly calibrated) can still give an accurate result when measuring a temperature difference as the systematic error will effectively cancel out. For help and guidance on the correct use of significant figures (sometimes called 'significant digits' by the IB) see the page on significant figures in the section on practical work. It is good practice to get students to always use scientific notation when using numbers or quantities as this makes the correct use of significant figures much clearer and easier. | Study guide
Pages 99 & 100 QuestionsFor ten 'quiz' multiple choice questions with the answers explained see MC test: Uncertainties & errors. For short-answer questions see Uncertainty & error questions together with the worked answers on a separate page Uncertainty & error answers. Vocabulary listquantitative data IM, TOK, 'Utilization' etc.See separate page which covers all of Topic 11. Practical work
|
Teaching slides
Teachers may wish to share these slides with students for learning or for reviewing key concepts.
Uncertainty & errors in measurement & results:
Uncertainty & errors in measurement & results:
Uncertainty & errors in measurement & results:
Uncertainty & errors in measurement & results:
Uncertainty & errors in measurement & results:
Uncertainty & errors in measurement & results:
Uncertainty & errors in measurement & results:
Uncertainty & errors in measurement & results:
Uncertainty & errors in measurement & results:
Uncertainty & errors in measurement & results:
Uncertainty & errors in measurement & results:
Uncertainty & errors in measurement & results:
Other resources
1. Stephanie Bell at the National Physics Laboratory has produced a really good guide entitled, "Beginners Guide to Uncertainty of Measurement" . An electronic version can be downloaded free.
2. Precision versus accuracy by The Chemistry Solution. It contains some useful information for answering multiple choice questions on this topic.
3. Uncertainty in measurements by lewischemistry.
4. Using significant figures by Brightstorm
5. Calculating overall uncertainties by Richard Thornley