pH titration curves
 18.3 pH curves (5 hours)
Pause for thought
It might be instructive to ask students to try to plot a graph to show how the hydrogen ion concentration changes as 0.100 mol dm-3 sodium hydroxide solution is added to 50.0 cm3 of 0.100 mol dm-3 hydrochloric acid solution. The initial value before any of the sodium hydroxide solution has been added will be 1.00 x 10⁻¹ mol dm-3 and the final value when 100 cm3 of the sodium hydroxide solution has been added will be between 1.00 x 10⁻¹² and 1.00 x 10⁻¹³ mol dm-3. They will quickly realise that this will be almost impossible to draw using a linear scale. It is much easier using a logarithmic scale and should help them to really appreciate the need for the pH scale. It was the Danish chemist Søren Sørenson (1868 - 1939) who first realised this.

Søren Sørenson was the head of the laboratory at the Carlsberg brewery in Copenhagen (above) from 1901 until 1938 and first coined the term 'pH' in 1909.
It recommends that five hours are spent teaching this topic and yet there are some problems knowing exactly what depth of treatment is required. In Topic 18.2: Acid base calculations it clearly states that students do not need to do buffer calculations and in this topic the half-equivalence point is not listed as one of the characteristics of a pH curve (although the point where pH = pKa is!). However not only do students need to understand about salt hydrolysis but they also need to know how the pH range of an indicator relates to its pKa value and be able to identify the buffer region on the pH curve as well as know how buffer solutions work and can be prepared. They also need to be able to explain pH curves. Whilst it is beyond the syllabus to ask them how to prepare a buffer solution with a specified pH value I think it is not unreasonable to ask them to calculate the resulting pH when they know the concentration of both the acid (or alkali) and the concentration of the salt in a solution. This enables them to see that the pH change is very rapid at the equivalence point (except for the case of a weak acid titrated against a weak base) and also enables them to work out that at the half-equivalence point (the centre of the buffering region) for a weak acid/strong base titration the pH is equal to the pKa of the weak acid. This will also help Higher Level students who go on to study Option B where for one of the AHL sub-topics they do need to perform buffer calculations. Standard level students do not of course need to study this AHL sub-topic but rather bizarrely if Standard Level students opt to study Option D then buffer calculations do appear in the core of this option.
Nature of science
In recent years the increased power of instrumentation and developments in available techniques has resulted in a more reliable and ready measurement of pH.
Learning outcomesAfter studying this topic students should be able to: Understand:
Apply their knowledge to:
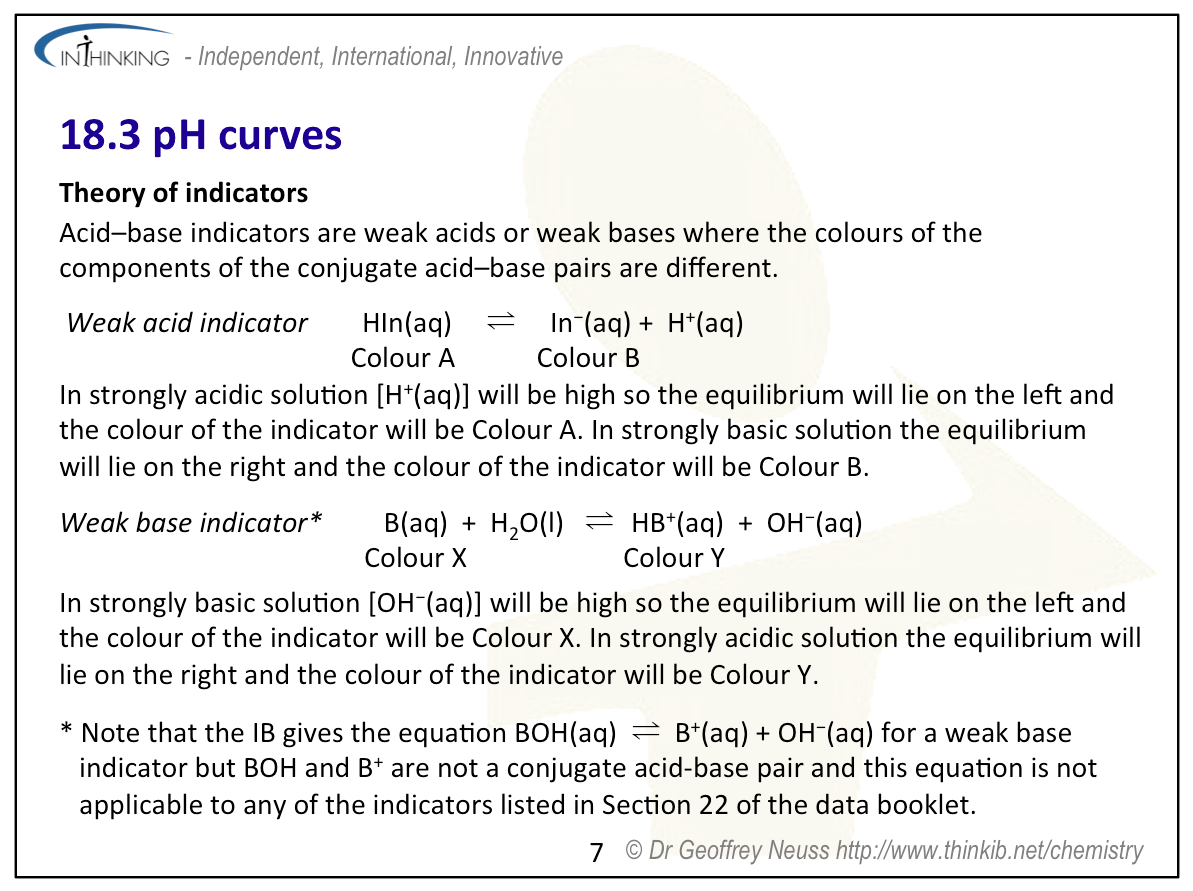
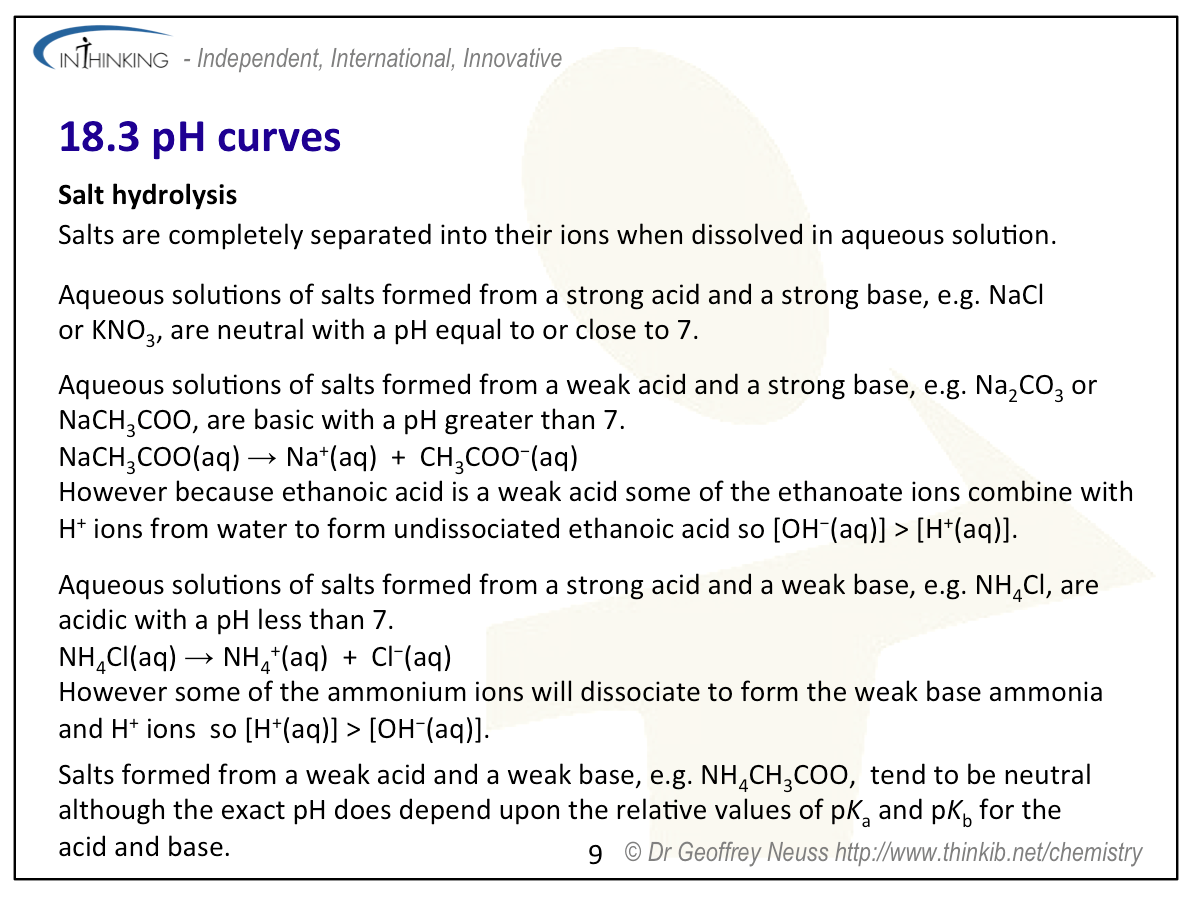
| Clarification notesThe characteristics of titration curves required are: For indicators which are weak acids the colour change can be considered to take place over a range of pKa ± 1. For indicator which are weak bases: Note that one subscriber to this website, Michael Porter from Colonel By Secondary School, Ottawa, has pointed out correctly that this equation, which is given on page 94 of the IB chemistry guide, is wrong as indicators that are weak bases do not dissociate to form the hydroxide ion. Instead they accept a proton from water so the equation should be B(aq) + H₂O ⇌ HB⁺(aq) + OH⁻(aq) A complete list of common indicators can be found at General Chemistry Online where it can be seen that none of them dissociate by losing hydroxide ions. See Section 22 of the data booklet for examples of indicators. Salts formed from all the four possible combinations of strong and weak acids with strong and weak bases should be considered. No calculations are required. Note that early editions of the current version of the programme stated in Topic 18.3 that the acidity of hydrated transition metal ions is covered in topic 13. This is incorrect and has subsequently been removed. The treatment of hydrated metal ions is not required. International-mindednessNothing is listed on the syllabus under this heading. |
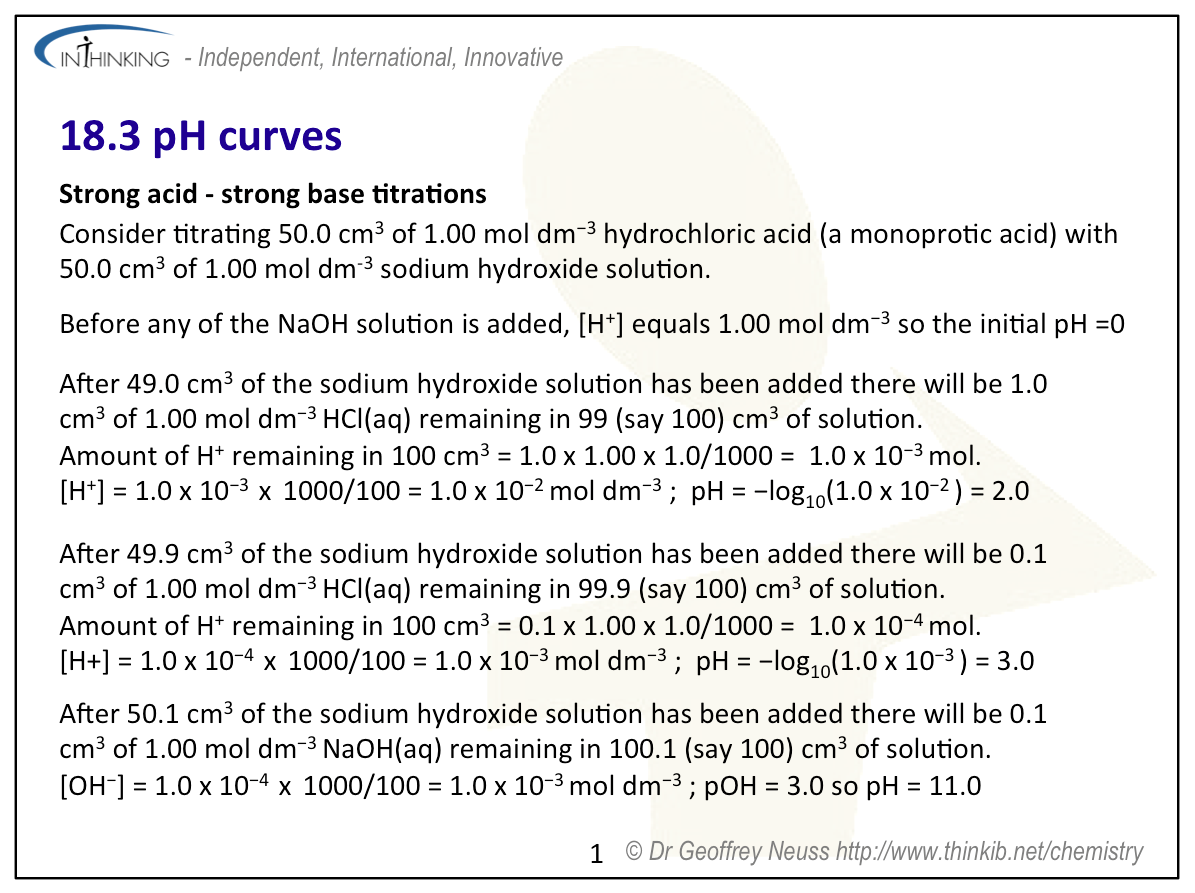
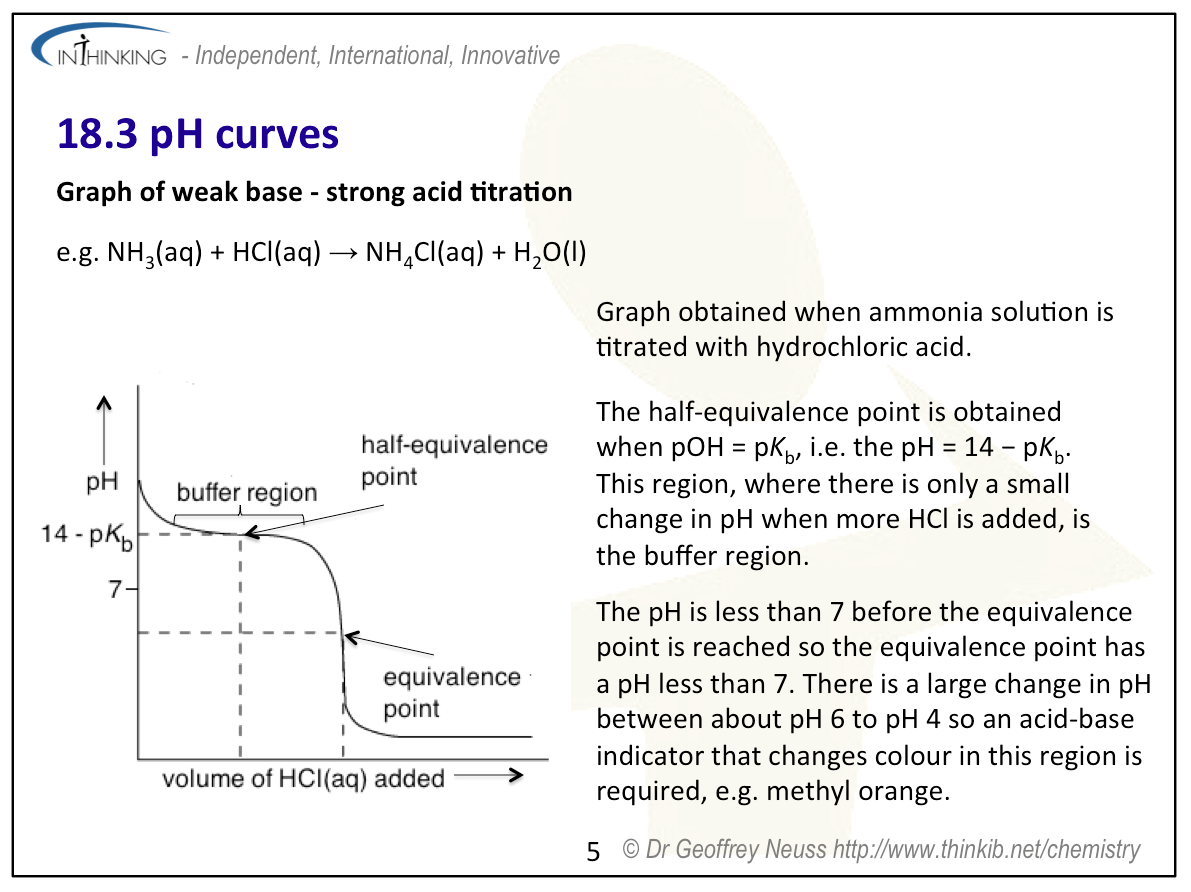
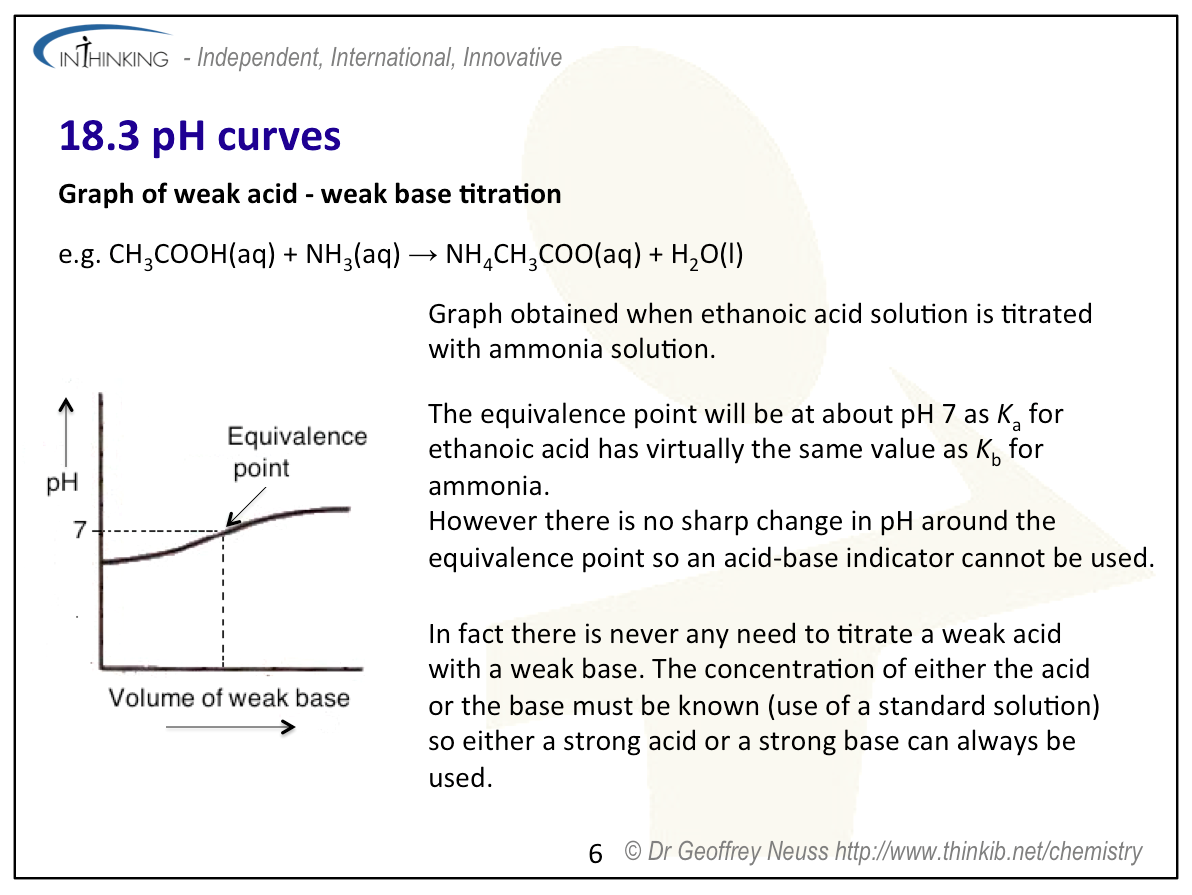
Teaching tipsI approach this both from a practical and theoretical viewpoint. It is useful practice to work out the expected pH when 49.0 cm3 of 0.100 mol dm-3 sodium hydroxide solution is added to 50.0 cm3 of 0.100 mol dm-3 and then give each person in the class the task of working out the expected pH when the volume of sodium hydroxide is successively increased by 0.1 cm3 until the volume added reaches 51.0 cm3. Give them a different one each to do then build up a table of the results so that they can see that there is a mirror image pattern present. They also see that even when 49.9 cm3 of the sodium hydroxide solution has been added the resulting solution still has a low pH. You will need to explain salt hydrolysis to show for example that the salt of a weak acid with a strong base, e.g. sodium ethanoate, will be alkaline whereas the salt of a strong acid with a weak base, e.g. ammonium nitrate, will be acidic in aqueous solution. You will also need to explain how indicators work and how their effective range is governed by their pKa value. You can then get them to sketch the graphs for the different combinations of weak and strong acids and bases and to determine which would be the most suitable indicator for a particular titration.. When sketching the graphs make sure students show that the sudden change in pH around the equivalence point is virtually a straight line - many students show this as a slope changing over one or two cm3 of added solution which is clearly wrong. Emphasise on the sketched graphs the importance of:
Finally get them to do at least one acid-base titration practically which they follow with a pH meter and use a simulation to show the others. | Study guide
Pages 66 - 67 QuestionsFor ten 'quiz' multiple choice questions with the answers explained see MC test: pH curves. For short-answer questions which can be set as an assignment for a test, homework or given for self study together with model answers see pH curves questions. Also see the link to a set of problems from the National Math + Science Initiative in 'Other resources' below. Vocabulary list:Equivalence point IM, TOK, Utilization etc.See separate page which covers all of Topics 8 & 18 Practical work |
Teaching slides
Teachers may wish to share these slides with students for learning or for reviewing key concepts.
pH curves:
pH curves:
pH curves:
pH curves:
pH curves:
pH curves:
pH curves:
pH curves:
pH curves:
pH curves:
pH curves:
pH curves:
pH curves:
Other resources
1. A straightforward informative video about titration curves by Clutch Prep.
2. Richard Thornley's video from the old programme "18.4.1 Sketch the general shapes of graphs of pH against volume for titrations".
3. A Useful set of problems on pH curves together with the worked answers from the National Math + Science Initiative.