Software for graph plotting
Rationale
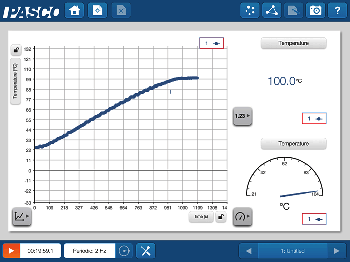
 Completion of the form 4/PSOW requires that students must use graph plotting software at least once during their practical course but it does not have to be assessed. Maybe I am a little old fashioned but I still like to get students to plot at least one graph by hand so that they fully understand how to use scales correctly. This is because I see from marking questions involving graphs on Papers 2 & 3 that a surprising number of students worldwide still cannot read a graph correctly even at the end of their two-year course. However, once they have the basic graphing skills it makes sense for them to use software to plot all the rest of their graphs. Many will already know how to do this but some may have to be taught. There are many programmes they can use – perhaps one of the best is Loggerpro from Vernier but since every student has access to Microsoft Office Excel I tend to stick to Excel as it is capable of doing all that is required for IB Chemistry students. Other data logging software (e.g. SPARKvue from Pasco - see right) is also suitable for doing all this too.
Skills
It is worth noting that in the Teacher's Support Material (TSM) it specifically states that students should explain how data is processed in their lab reports and so a copy of table(s) including all raw data should be included. What this means is that a graph alone, even if it is produced by a data logger, will not suffice. The raw data should be shown in tabular form first.
Unlike some of the other Group 4 subjects (e.g. Physics), students are not expected to draw lines of minimum and maximum fit to the data points nor do they have to include error bars (or combine errors through root mean squared calculations). So what do they have to know?
There are seven skills that students need to know how to perform:
- Add headings to columns or tables
- Enter data into a table
- Choose the correct quantities to graph/plot
- Choose an appropriate scale
- Correctly label the axes (including units)
- Construct a line (or curve) of best fit
- Add a title
Once the graph is completed they should also know how to use it to process data. This includes interpolation, extrapolation and taking a tangent.

 IB Docs (2) Team