Spreadsheets for data processing
Introduction
Spreadsheets in their current form have been around since the early 1980s. Essentially a spreadsheet consists of multiple cells. A cell contains data in the form of numbers, alphIB Docs (2) Teammeric text or formulas. These multiple cells make up a grid consisting of rows and columns. A formula can be used to define how the contents of that cell can be calculated from the contents of any other cell. One of the main uses of spreadsheets is in financial markets where real time share prices can be used to recalculate and update whole portfolio values etc. In science they are useful when data is being manipulated especially when complex formulas are used.
By the time they are aged 16, many students are already familiar with spreadsheets as the most common one in operation currently is Excel which forms part of the Microsoft Office suite. This programme is useful in Chemistry as it not only acts as a spreadsheet but can also be used as a graphing tool. However although students may be familiar with Excel it is surprising perhaps that many of them only use it for very simple applications and are unable to put in their own formulas to carry out more complex operations. Excel is fine for fulfilling the IB ICT requirements but it is worth remembering that it was designed originally for commercial not scientific purposes. This is particularly true when it comes to graphing and choosing the correct axes etc.
Although students are only actually required to use a spreadsheet once during their internally assessed work it is worth ensuring that they do at least know the basic skills of operation and it might be worth giving them an exercise early on in their course. This will not only be useful for their normal practical work but may also be of use with other parts of their IB Diploma programme such as their Extended Essay. The skills they learn will also be of use at university and beyond. Keen students will delve into the sophisticated manipulations that Excel can achieve but all students should be reasonably conversant in the following basic skills.
- Add headers to columns
- Enter data
- Fill down a column (and across rows if necessary)
- Format cells
- Add a function
- Sort columns
Teachers too need to be familiar with using a spreadsheet. One of the most useful ways I use it is to convert raw marks in mock exams to percentage marks and a final grade so that I can use this information to help me arrive at a predicted grade (and also tell the students what grade they have achieved). It might be helpful to go through this step by step to give you an idea of how the spreadsheet works. You can then devise your own example to give to students.
Using a spreadsheet to determine a percentage mark and final grade
The problem
For their mock exams Higher Level students take three papers. Paper 1 is marked out of 40 and counts 20% towards the final mark of 100%. Paper 2 is marked out of 95 and counts 36% of the final mark of 100% and Paper 3 is marked out of 45 and counts 24% of the final mark of 100%. The Internal Assessment is marked out of 24 and counts for the remaining 20% of the final mark of 100%. The problem is to convert all the raw marks for the four components into the weighted percentage and then sum them to give the overall mark.
Step I
Name columns A, B, C, D, E with Student’s name, Paper 1 /40, Paper 2 /95, Paper 3 /45 and IA /24 respectively. You will need to expand the width of each column to ensure there is enough space for the writing.
Step 2
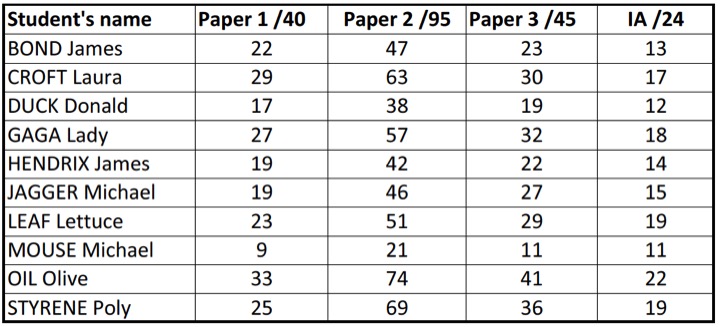
Enter each student’s name and the marks they received for the three different mock exam papers and for their IA in the correct columns. At this stage you will have entered all the raw data (see below).

Step 3
We now need to convert this into a total percentage mark.
i. Label a new column Total /100 (existing column F)
II. Place the cursor in the first entry in this column (F2 - lined up with the name BOND James)
iii. We need to convert the mark for Paper 1 (column B) to a mark out of 20 so this becomes (B2*20/40), the mark for Paper 2 to a mark out of 36 so this becomes (C2*36/95) and the mark for Paper 3 to a mark out of 24 so this becomes (D2*24/45) and the IA to a mark out of 20 so this becomes (E2*20/24 and then add these up to give a total mark out of 100.
This becomes (B2*20/40) + (C2*36/95) + (D2*24/45) + (E2*20/24)
Now place all this between brackets after an equals sign.
So the cursor now says = ((B2*20/40) + (C2*36/95) + (D2*24/45) + (E2*20/24))
This should now appear in box F2. Pressing return will enable it to calculate the value which is 51.9105263
iv. Since the IB only deals in whole numbers go to the 'decrease number of decimal places' box above and keep clicking on the decrease decimal button until the number 52 is all that is left.
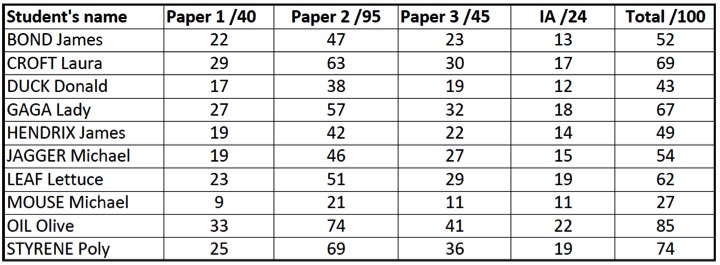
v. Put your cursor on the little + sign at the bottom of box F2 and pull it down all the way to box F11. Your table should now look like this:

Step 4
We now need to sort the table. You might wish to do this several ways. Firstly to put them in order so you can add the grades. Highlight all the data. Go to ‘Data’ then ‘sort’ on the top bars. A box will open up asking you how you wish to sort your data. Sort by percentage value and largest to smallest. To give:

Now add the grades in a new column (G) according to the Grade boundaries you have agreed on.

You can resort the list alphabetically by student’s name so that when you enter the marks on the grade cards, or whatever, you have them in the right order – which all makes your life a lot easier!
Step 5
You can now try the same exercise again for yourself - but this time for your Standard Level students where, although the IA still accounts for 20% of the final mark, some of the weightings of the three papers are different.

 IB Docs (2) Team