18.3 pH titration curves
Written specifically for students to provide help and support for the IB Diploma chemistry programme this page provides full coverage of the syllabus content of Topic 18.3 pH titration curves. It encourages you to think critically and provides many questions with full worked answers so that you can monitor and improve your knowledge and understanding.

 Learning outcomes
After studying this topic students you be able to:
 Understand:
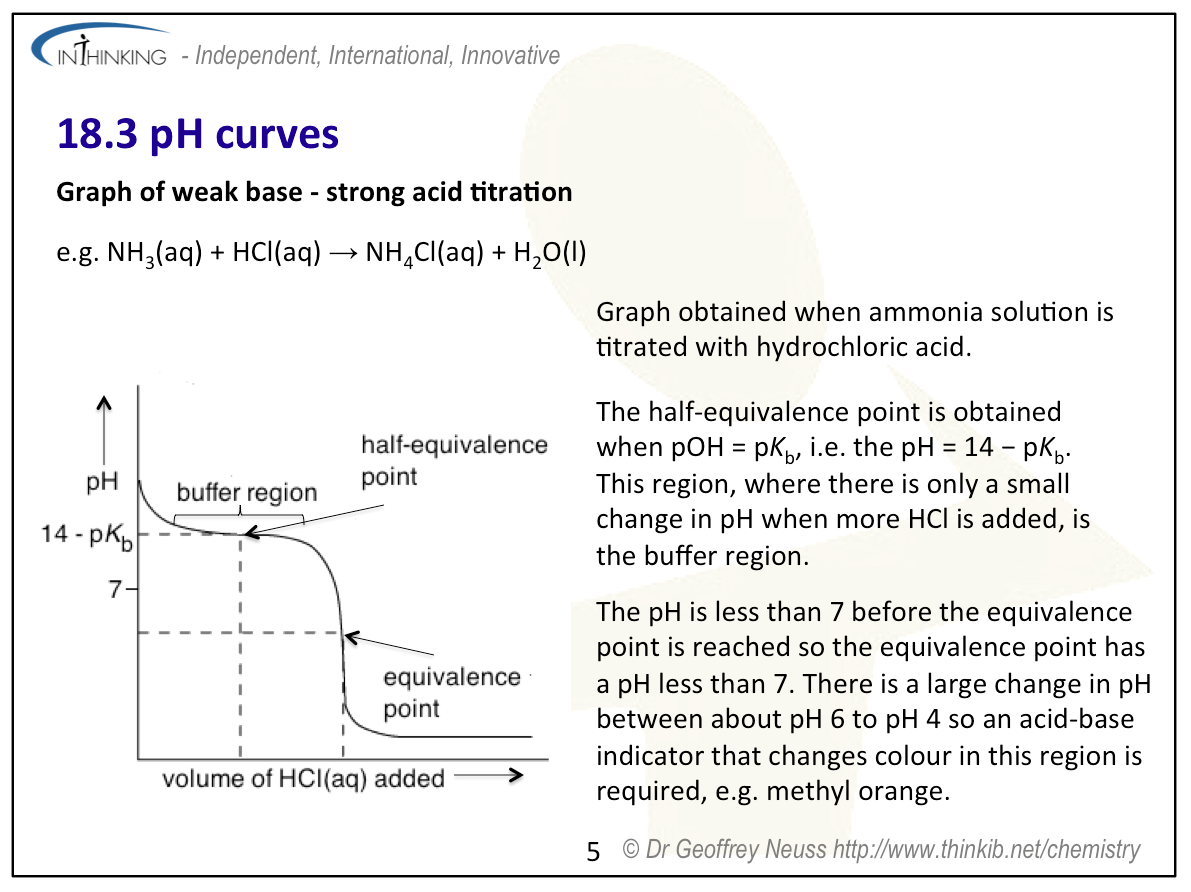
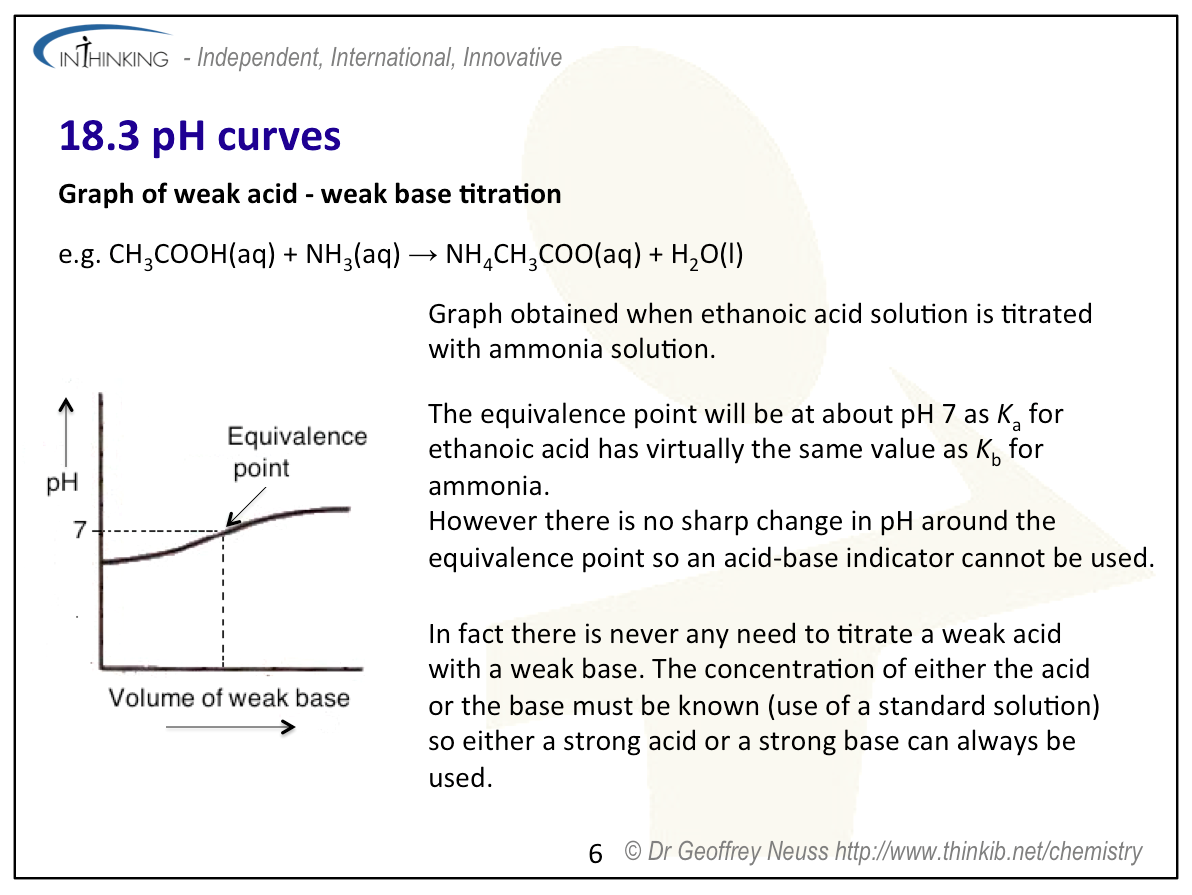
- pH curves produced by the different combinations of strong and weak acids and bases have different characteristics.
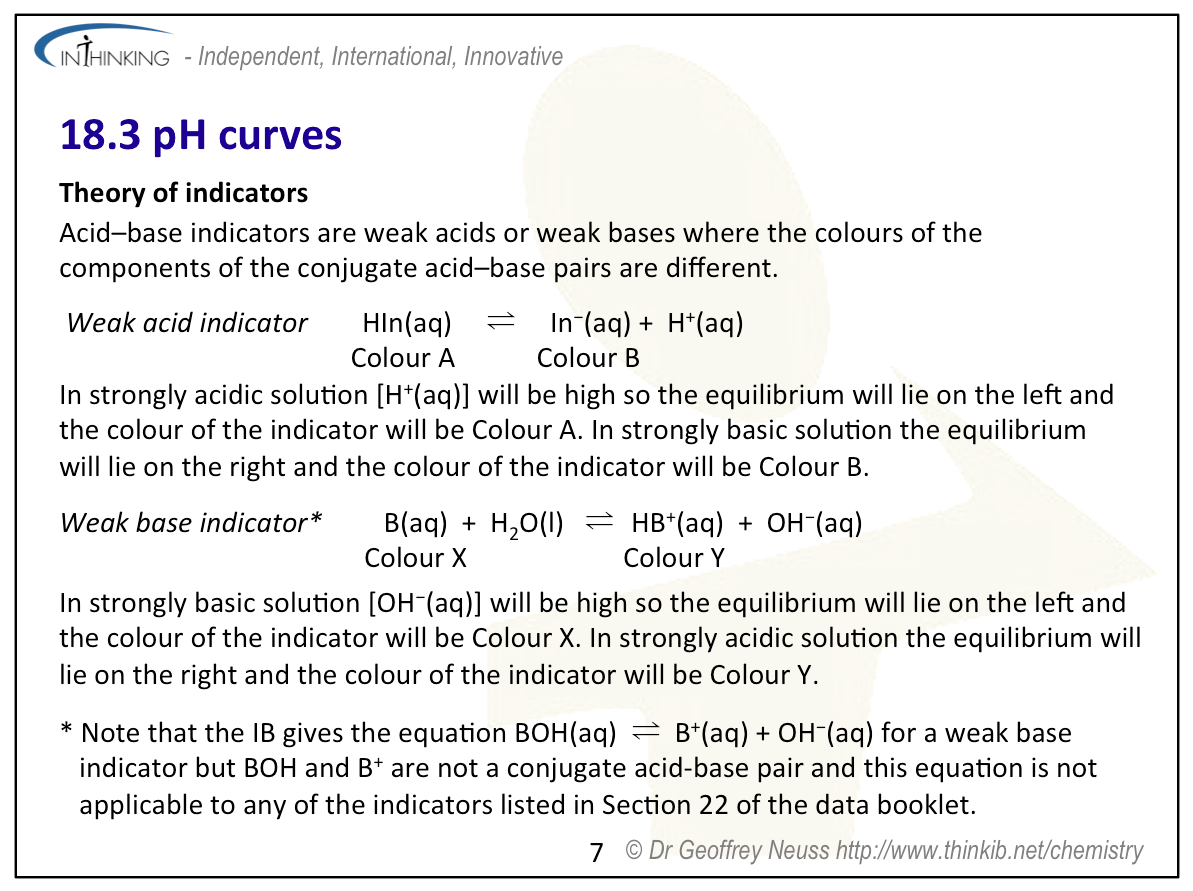
- Acid–base indicators are weak acids or weak bases where the colours of the components of the conjugate acid–base pairs are different.
- How the pH range of an acid–base indicator, (which is a weak acid) relates to its pKa value.
- The region on the pH curve where small additions of acid or base result in little or no change in pH represents the buffer region.
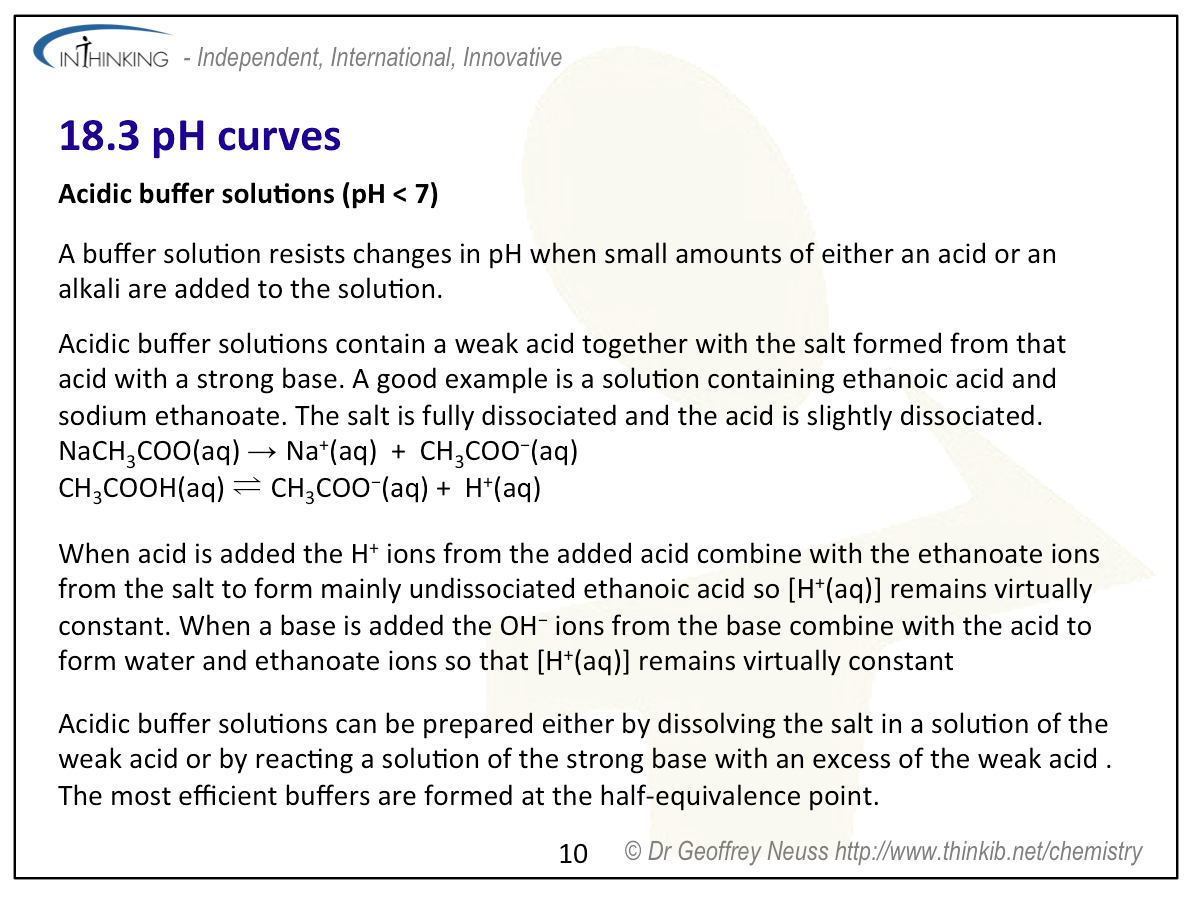
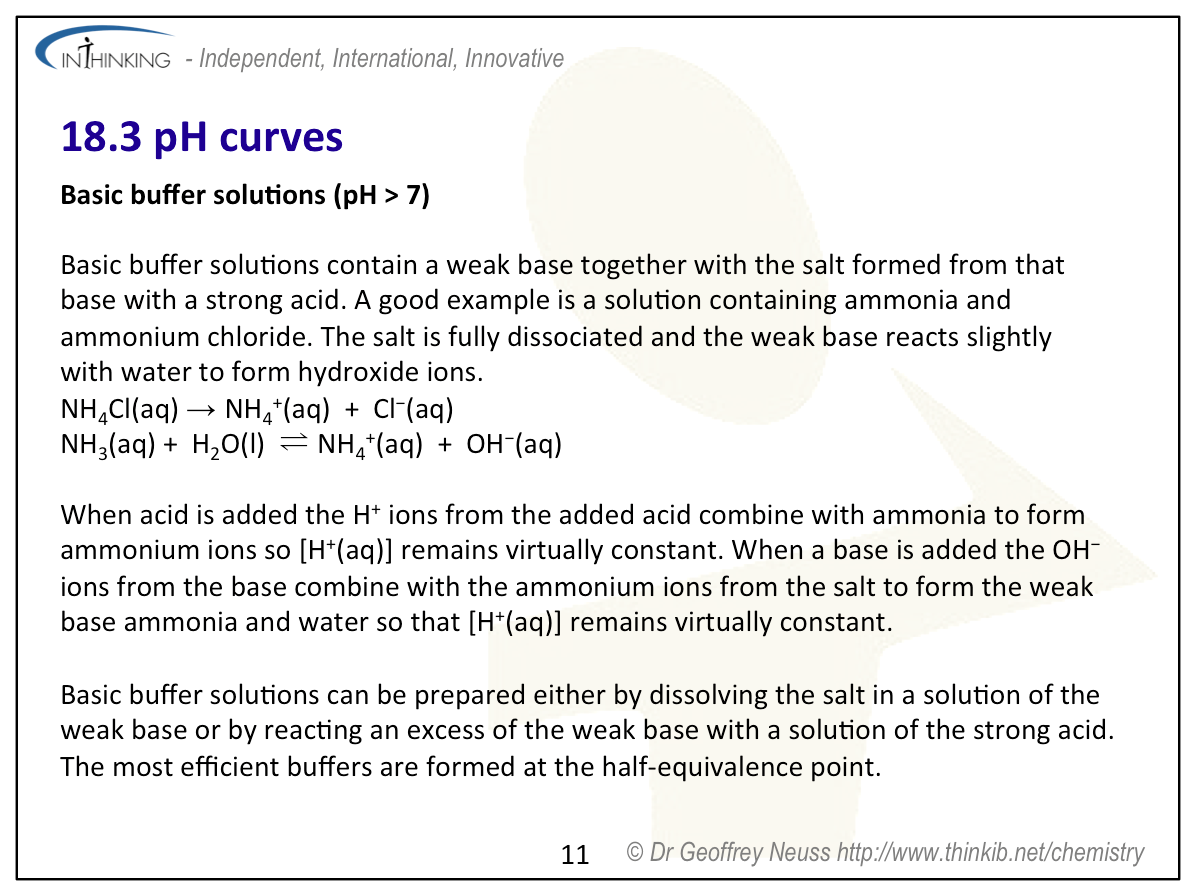
- The composition and mode of action of a buffer solution.
Apply your knowledge to:
- Explain the general shapes and important features of graphs of pH against volume for titrations involving strong and weak acids and bases.
- Select an appropriate indicator for a titration, given the equivalence point of the titration and the end point of the indicator.
- Understand that buffer solutions can be prepared either by mixing a weak acid/base with a solution of a salt containing its conjugate base/acid, or by partial neutralization of a weak acid/base with a strong acid/base.
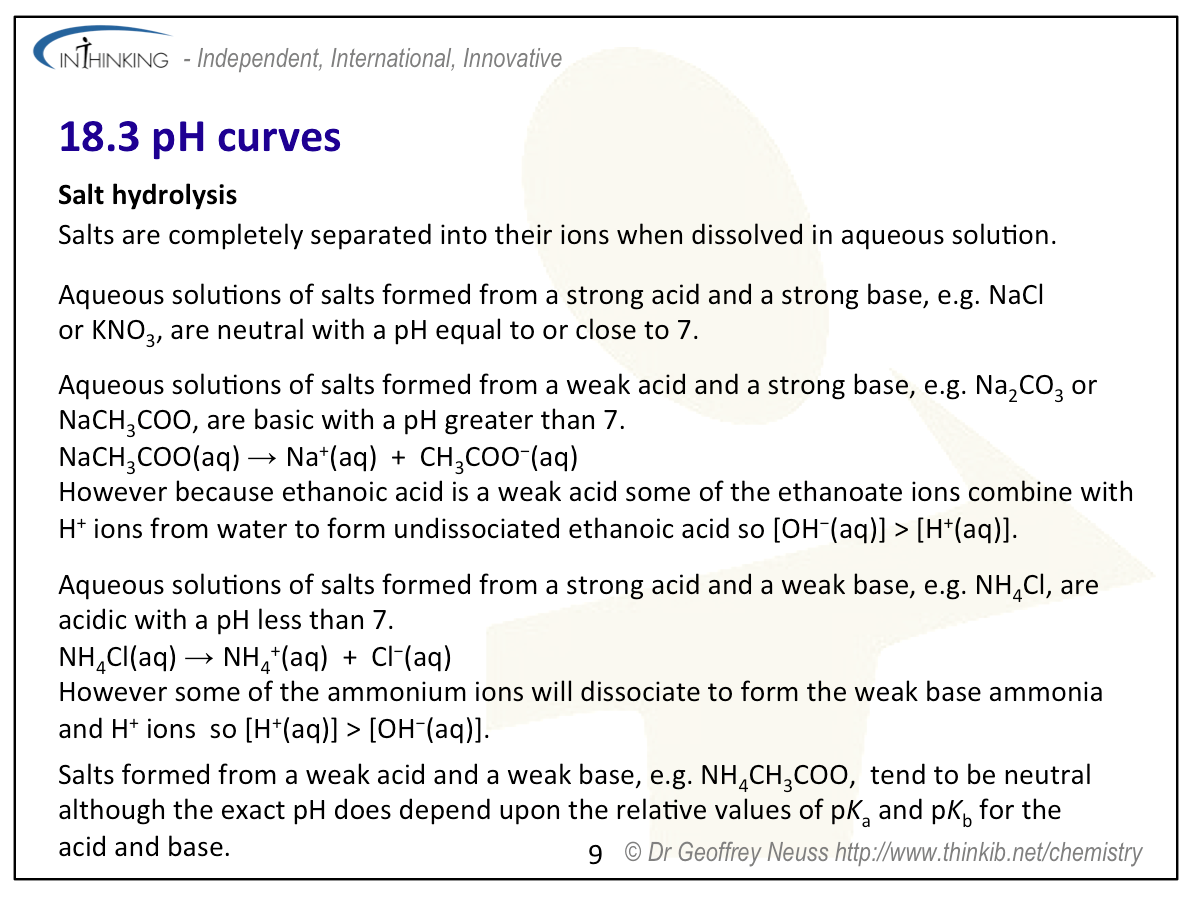
- Predict the relative pH of aqueous salt solutions formed by the different combinations of strong and weak acids and bases.
Relationships & vocabulary
Nature of science
In recent years the increased power of instrumentation and developments in available techniques has resulted in a more reliable and ready measurement of pH.
International-mindedness
For examples and links to International mindedness, Theory of knowledge, utilization etc. see separate page which covers all of Topics 8 & 18: Acids & bases.
Vocabulary
| equivalence point | end-point | buffer region |
| half-equivalence point | aliquot | titre |
Learning slides
You can use this slide gallery for learning or for reviewing concepts and information. It covers all the key points in the syllabus for this sub-topic.
pH curves:
pH curves:
pH curves:
pH curves:
pH curves:
pH curves:
pH curves:
pH curves:
pH curves:
pH curves:
pH curves:
pH curves:
pH curves:
Something to think about
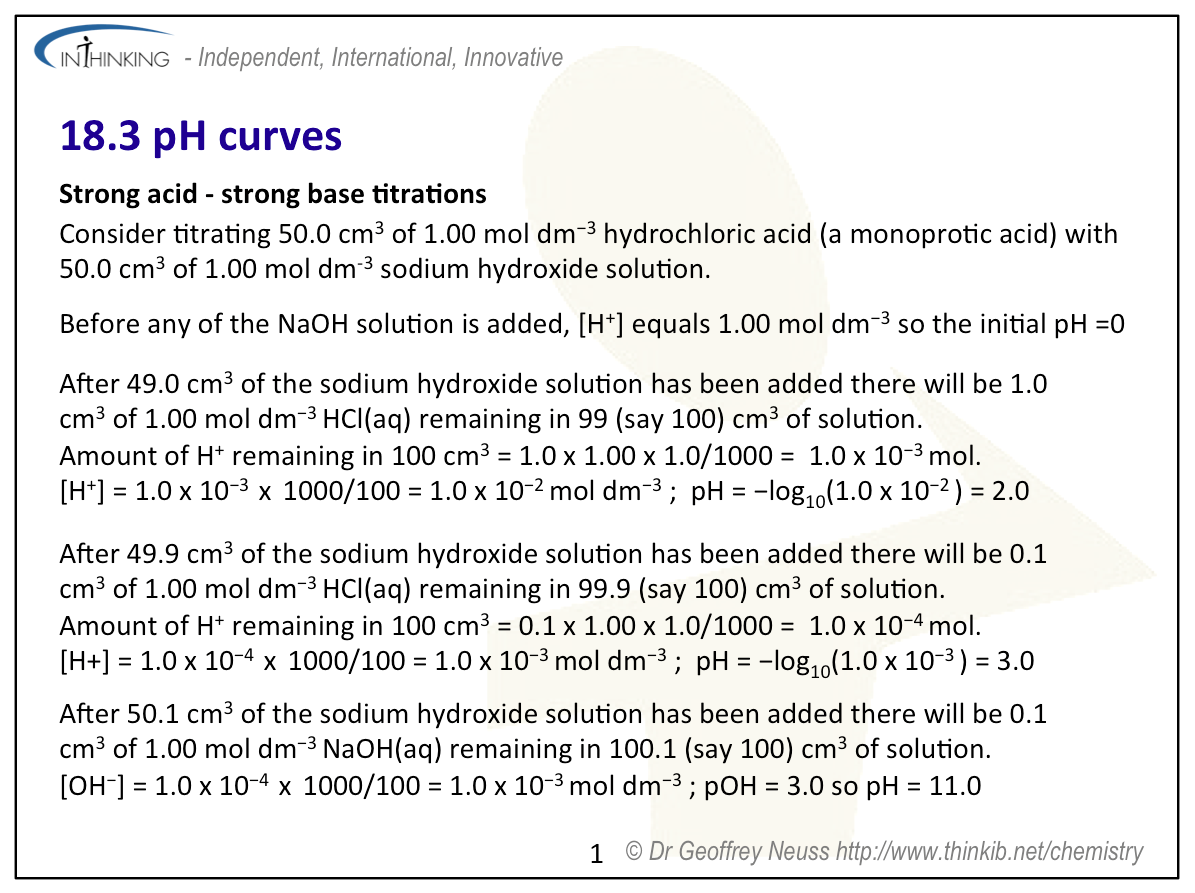
It might be instructive to try to plot a graph to show how the hydrogen ion concentration changes as 0.100 mol dm-3 sodium hydroxide solution is added to 50.0 cm3 of 0.100 mol dm-3 hydrochloric acid solution. The initial value before any of the sodium hydroxide solution has been added will be 1.00 x 10⁻¹ mol dm-3 and the final value when 100 cm3 of the sodium hydroxide solution has been added will be between 1.00 x 10⁻¹² and 1.00 x 10⁻¹³ mol dm-3. You will quickly realise that this will be almost impossible to draw using a linear scale. It is much easier using a logarithmic scale and should help you to really appreciate the need for the pH scale. It was the Danish chemist Søren Sørenson (1868 - 1939) who first realised this.
Søren Sørenson was the head of the laboratory at the Carlsberg brewery in Copenhagen (above) from 1901 until 1938 and first coined the term 'pH' in 1909.
It can be difficult to know exactly what depth of knowledge and understanding is required. In 18.2 Calculations involving acids & bases it clearly states that you do not need to do buffer calculations and in this topic the half-equivalence point is not listed as one of the characteristics of a pH curve (although the point where pH = pKa is!). However not only do you need to understand about salt hydrolysis but you also need to know how the pH range of an indicator relates to its pKa value and be able to identify the buffer region on the pH curve as well as know how buffer solutions work and can be prepared. You also need to be able to explain pH curves. Whilst it is beyond the syllabus to ask you how to prepare a buffer solution with a specified pH value I think it is reasonable to expect you to be able to calculate the resulting pH when you know the concentration of both the acid (or alkali) and the concentration of the salt in a solution. This will enable you to see that the pH change is very rapid at the equivalence point (except for the case of a weak acid titrated against a weak base) and also enables you to work out that at the half-equivalence point (the centre of the buffering region) for a weak acid/strong base titration the pH is equal to the pKa of the weak acid. This will also help you if choose Option B: Biochemistry as your option where for one of the AHL sub-topics you do need to perform buffer calculations. If you are a Standard Level student then you do not of course need to study this AHL sub-topic but rather bizarrely if you opt to study Option D: Medicinal chemistry then buffer calculations do appear in the core of this option!
Test your understanding of this topic
(Note that your teacher may have restricted your access to some or all of these questions and worked answers if they are going to use them as a class test or set them as an assignment.)
For ten 'quiz' multiple choice questions with the answers explained see MC test: pH curves.
For short-answer questions see pH curves questions.
More resources
1. A straightforward informative video about titration curves by Clutch Prep.
2. Richard Thornley's video from the old programme "18.4.1 Sketch the general shapes of graphs of pH against volume for titrations".