11.3 Spectroscopic identification of organic compounds
Written specifically for students to provide help and support for the IB Diploma chemistry programme this page provides full coverage of the syllabus content of Topic 11.3 Spectroscopic identification of organic compounds. It encourages you to think critically and provides many questions with full worked answers so that you can monitor and improve your knowledge and understanding.
.png)

 Learning outcomes
After studying this topic you should be able to:
 Understand:
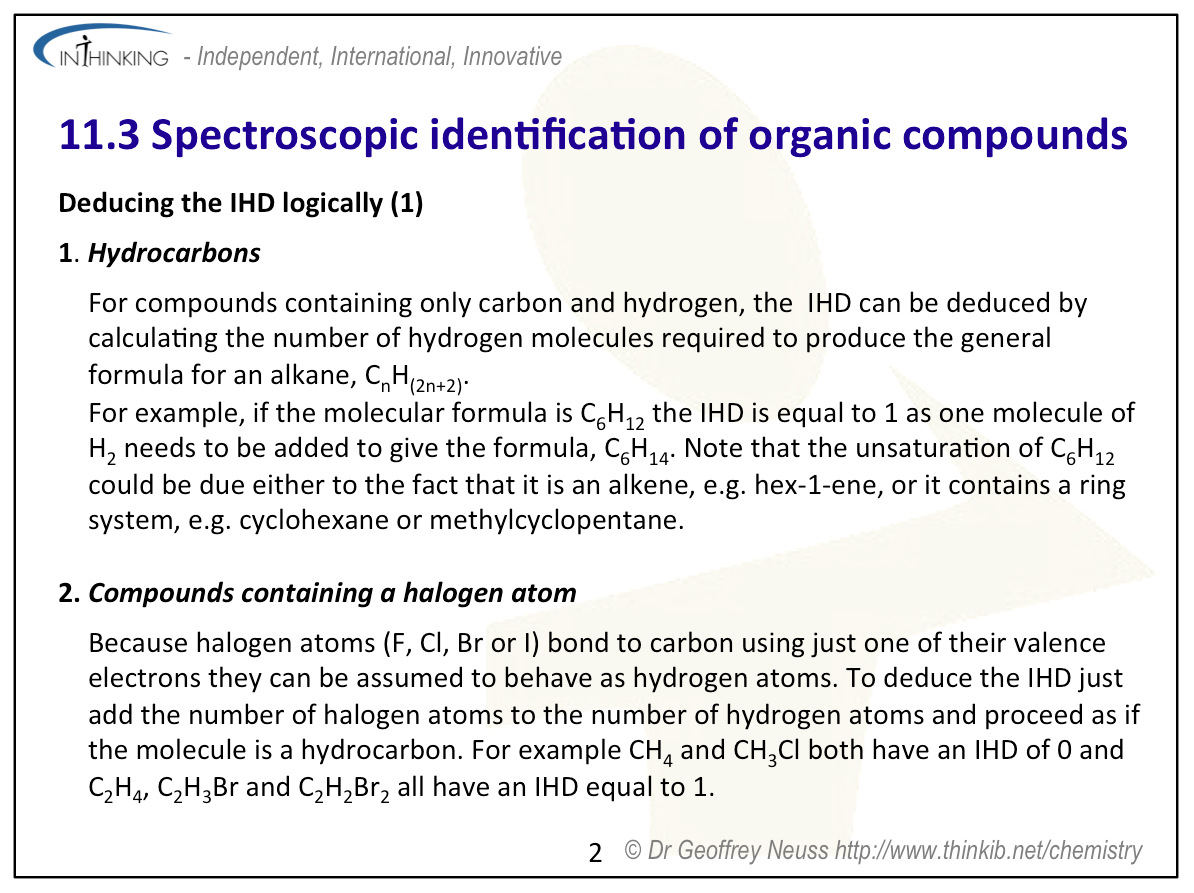
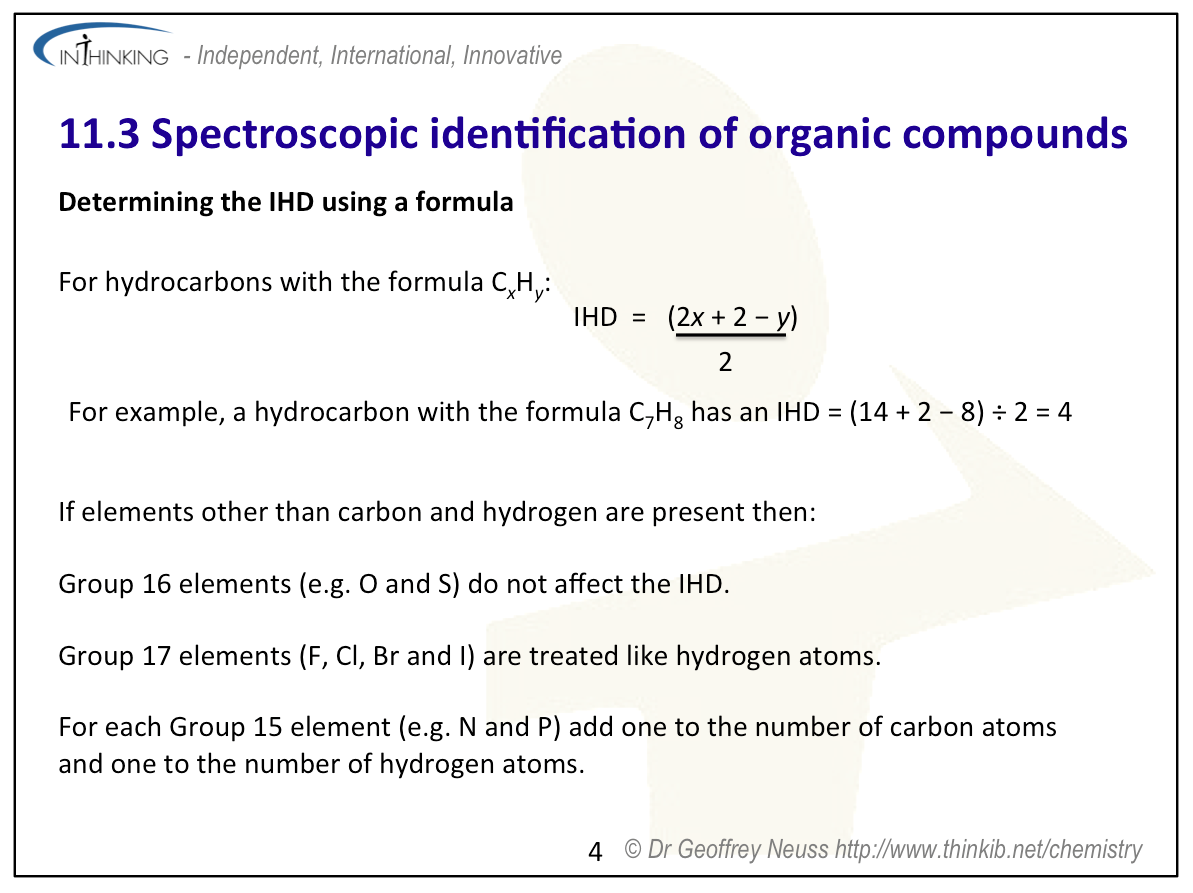
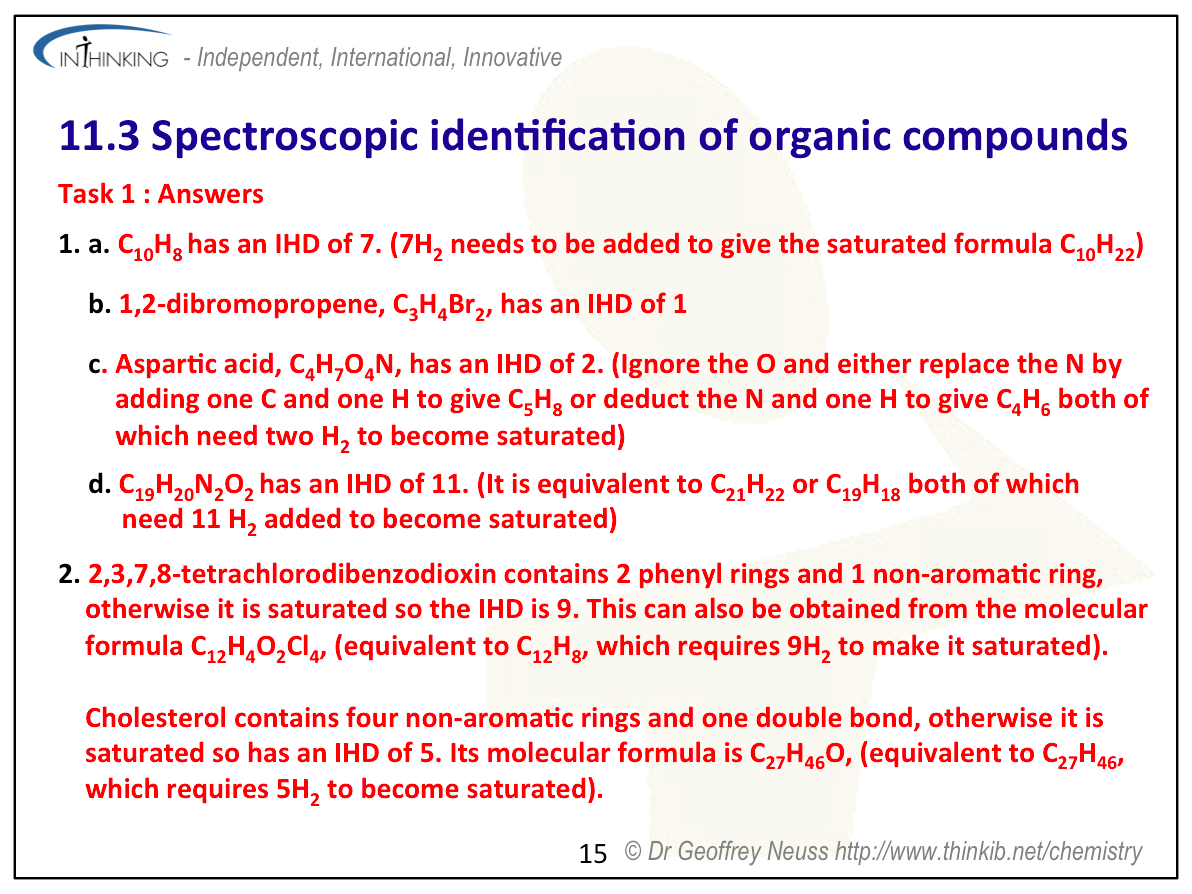
- The index of hydrogen deficiency, IHD, otherwise known as the degree of unsaturation. It can be used to determine the number of rings or multiple bonds in a molecule from its molecular formula.
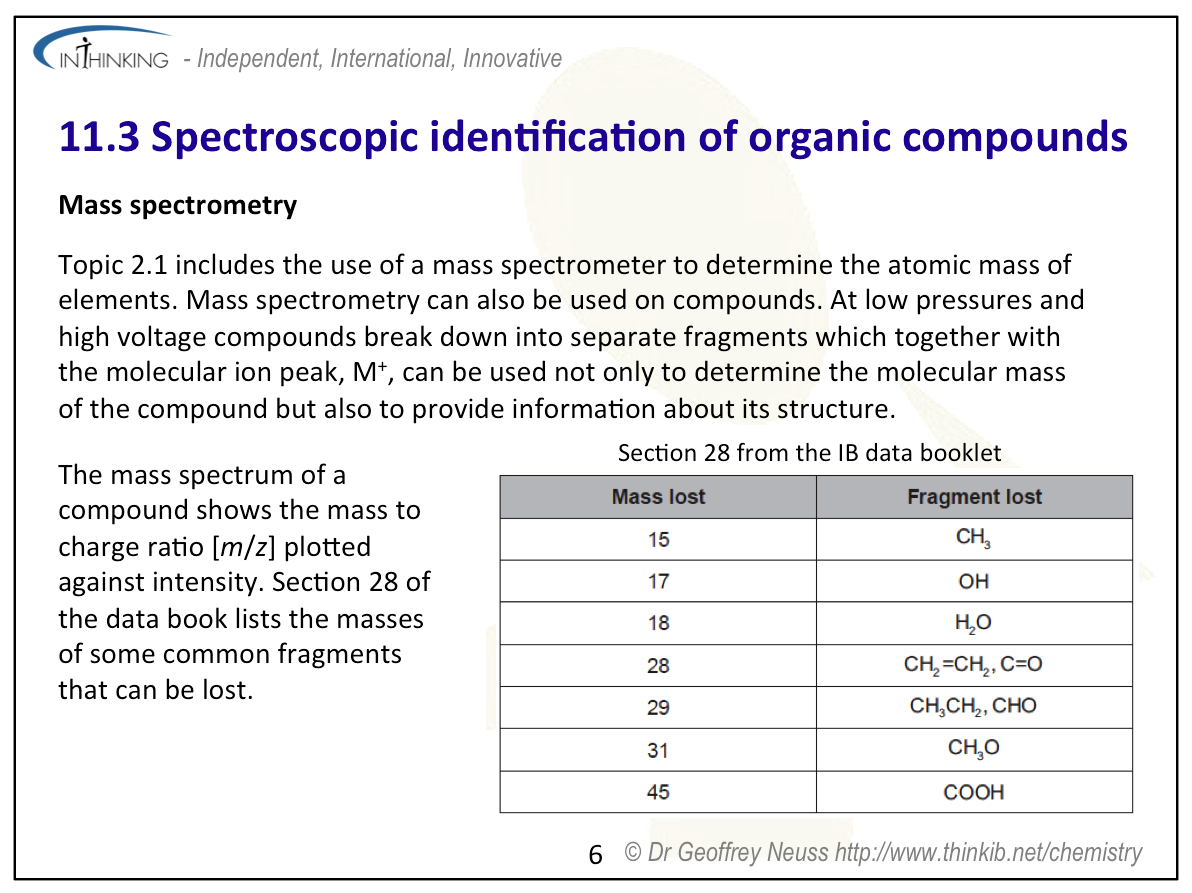
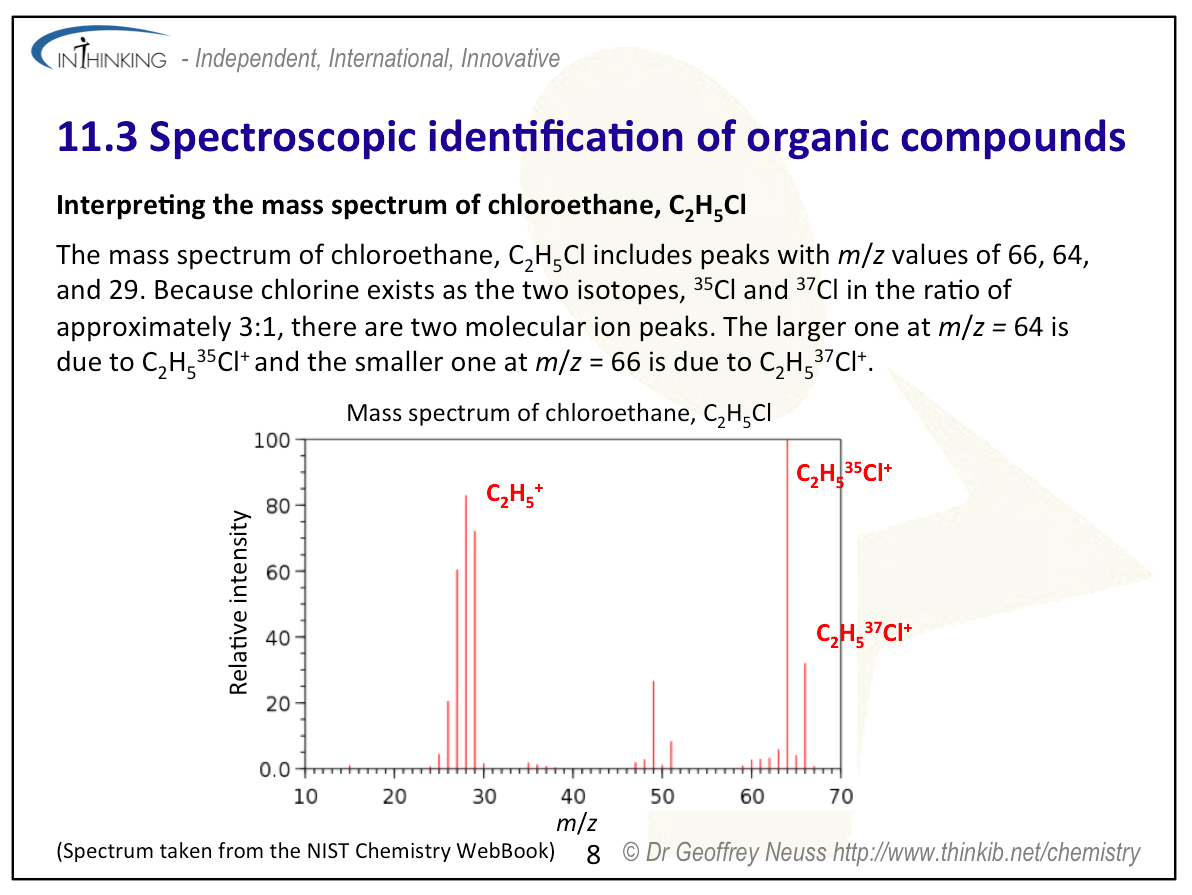
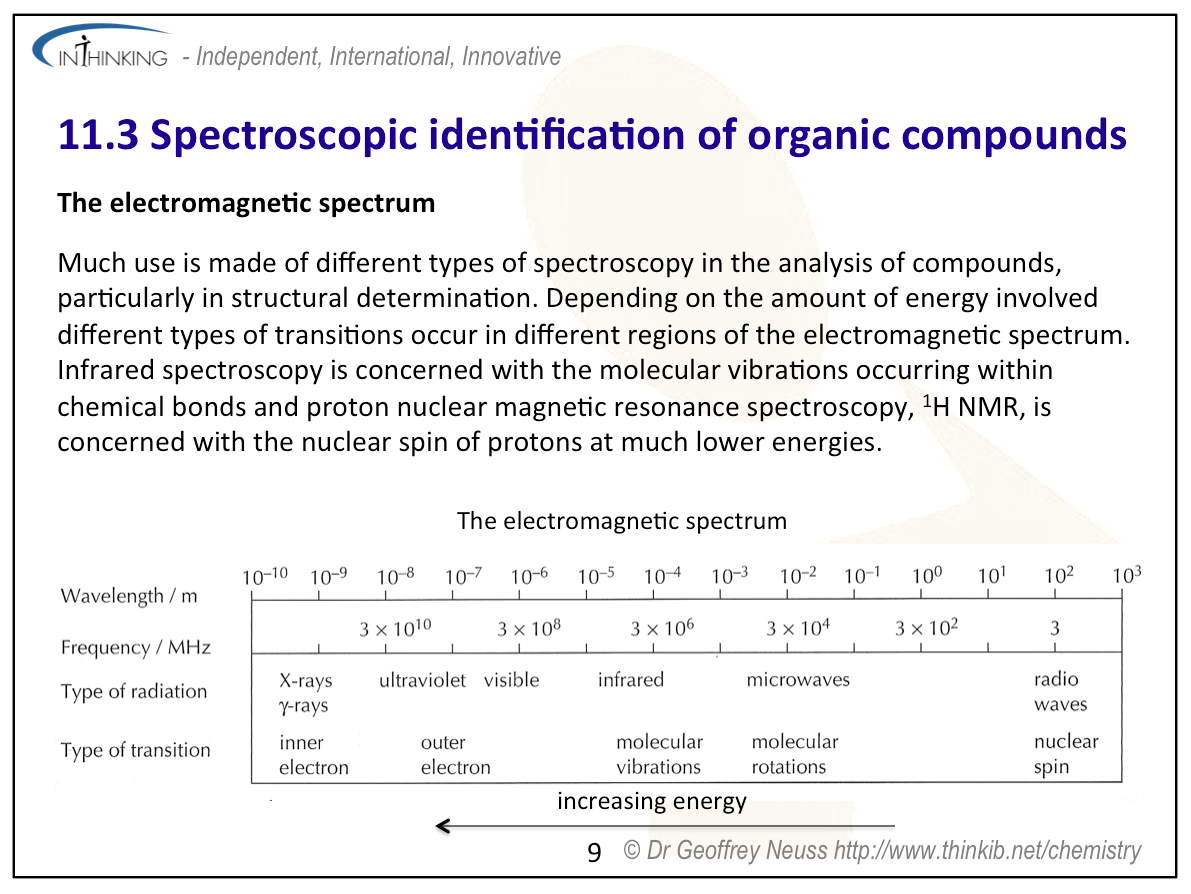
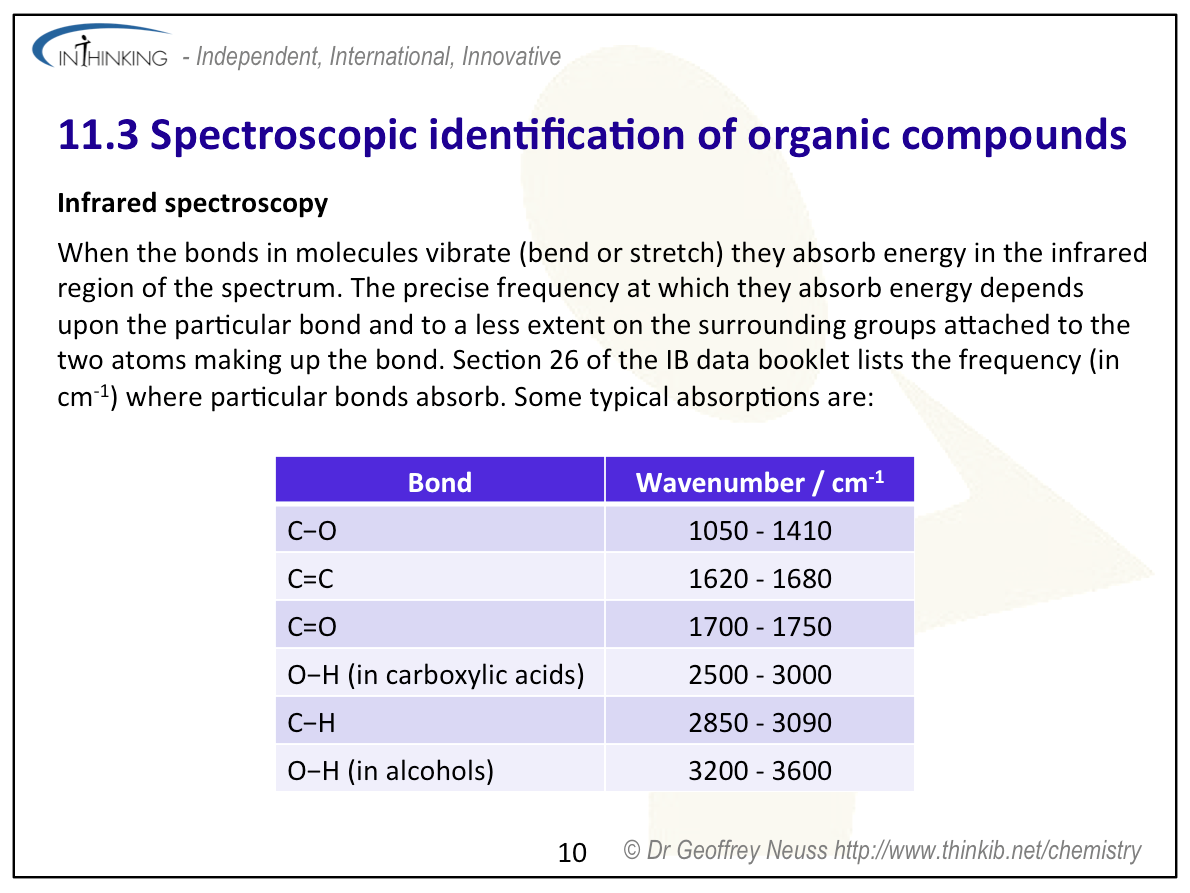
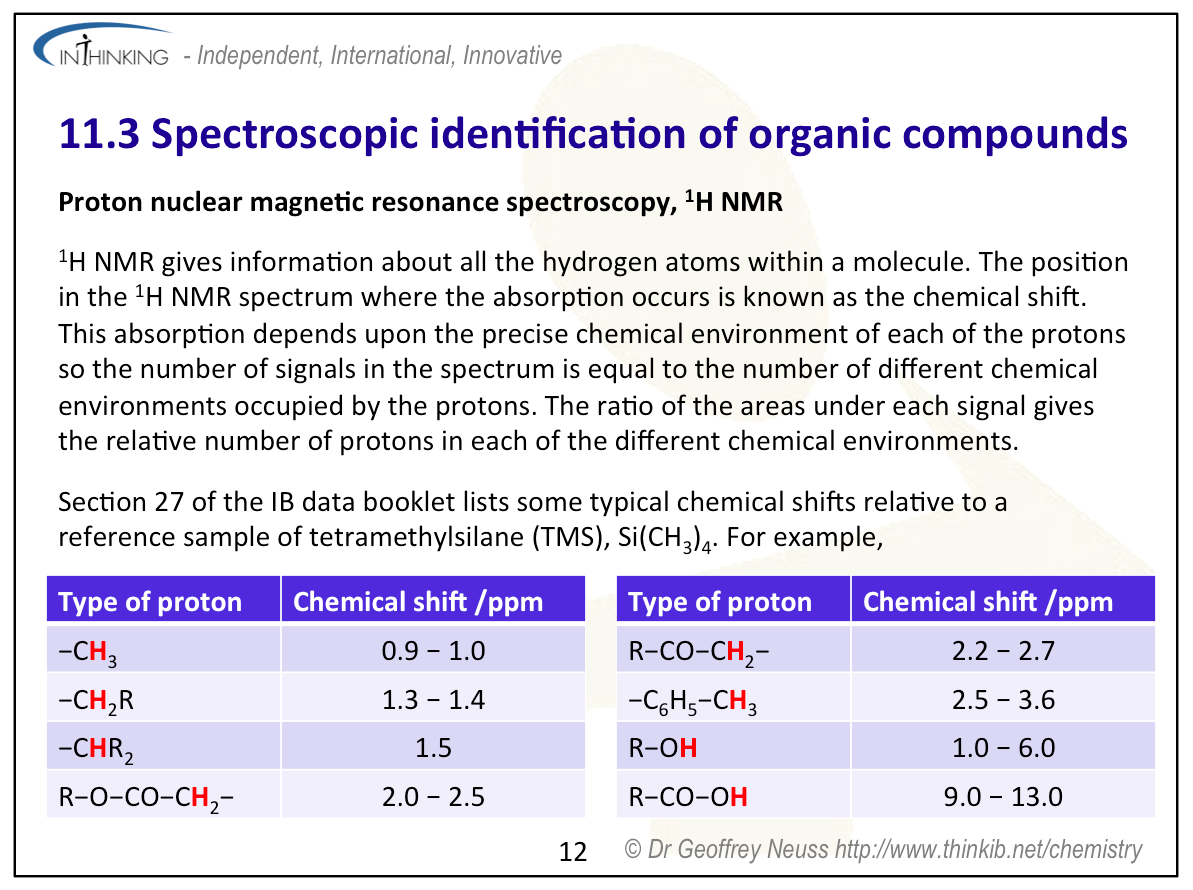
- Techniques that can be used to identify compounds and to determine their structure include mass spectrometry, MS, proton nuclear magnetic resonance spectroscopy, 1H NMR, and infrared spectroscopy, IR.
Apply your knowledge to:
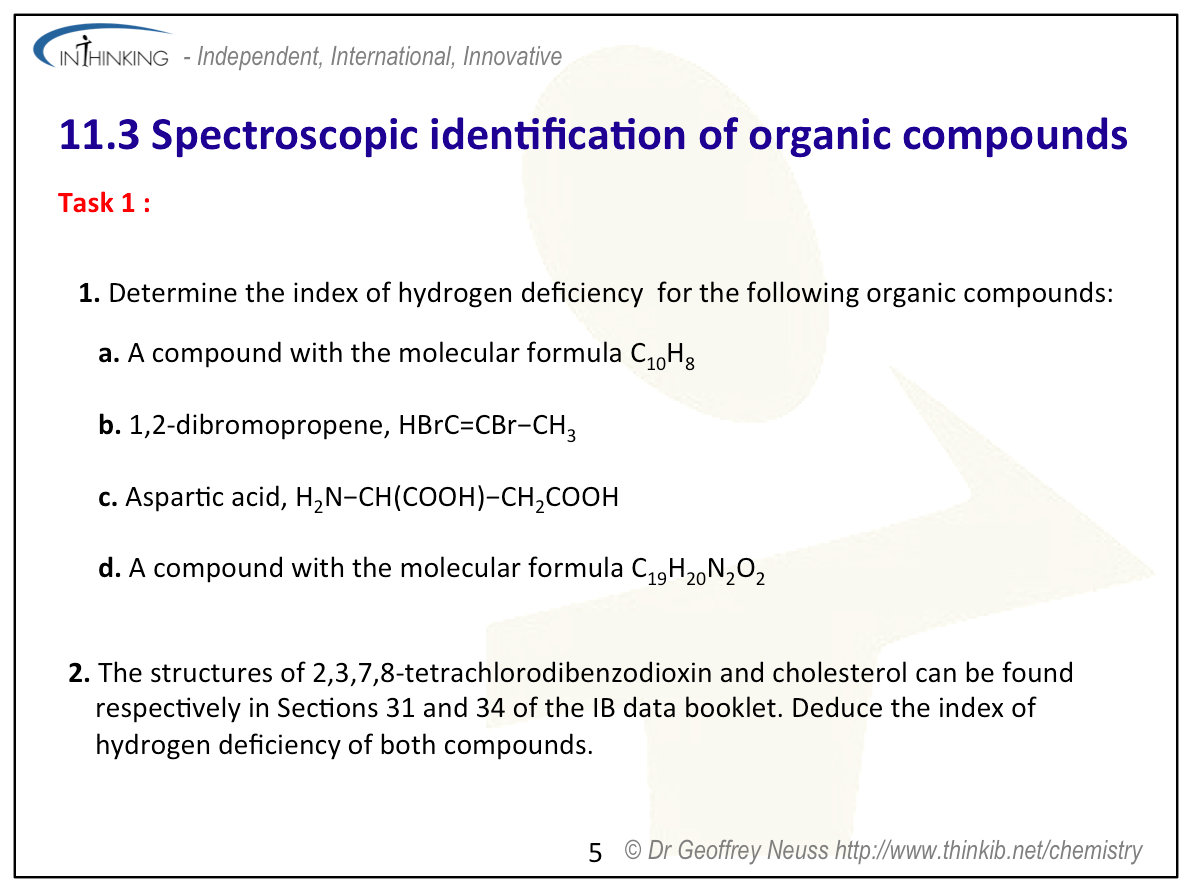
- Determine the IHD from a molecular formula.
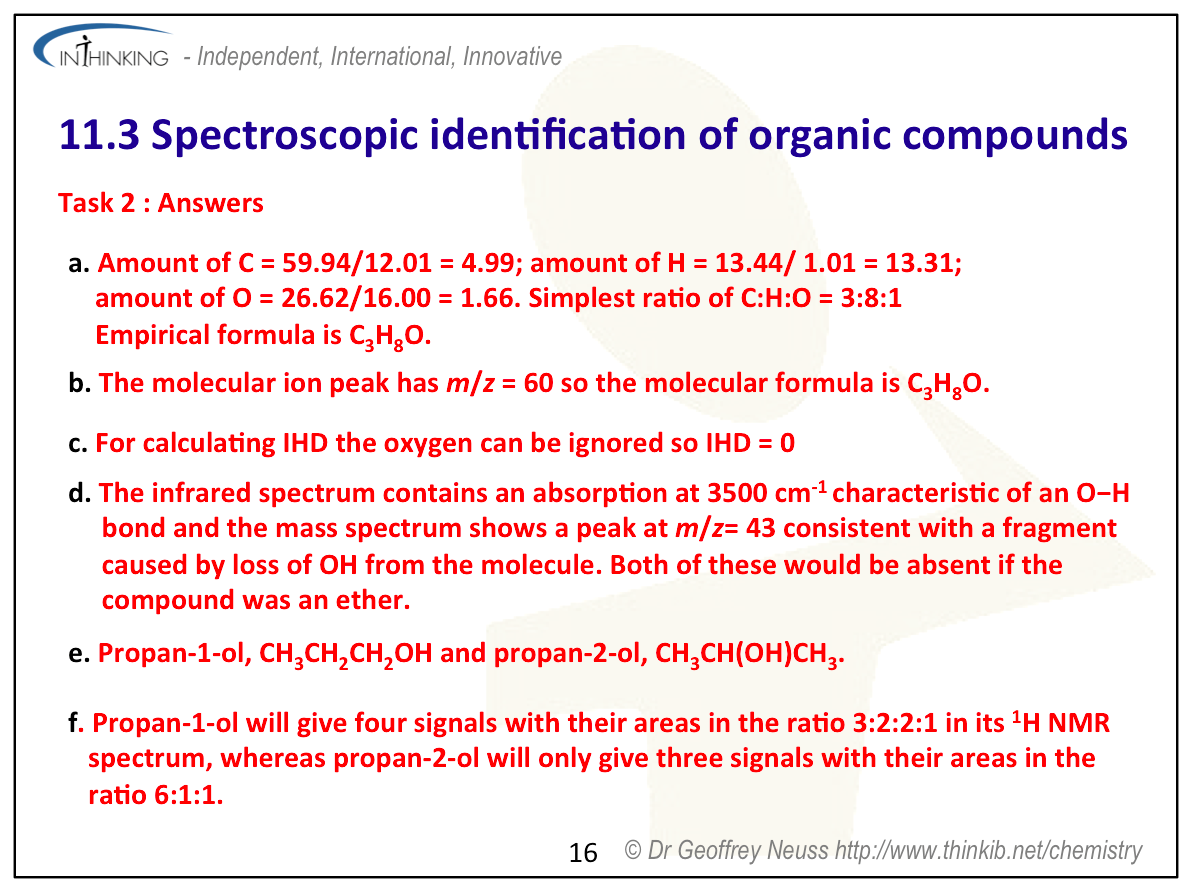
- Deduce information about the structural features of a compound from its percentage composition, MS, 1H NMR or IR.
Relationships & vocabulary
Nature of science
Identification and the determination of structure have become routine due to improvements in the instrumentation involved in mass spectrometry, proton nuclear magnetic resonance and infrared spectroscopy.
Models have been developed in order to explain some phenomena, e.g. spectra based on the model of bond vibrations, that may not be observable.
International-mindedness
Scientists from different countries continually collaborate to monitor and analyse the presence and amounts of toxins and xenobiotics in the environment using spectroscopic techniques.
For more examples and links to International mindedness, Theory of knowledge, utilization etc. see separate page which covers all of Topics 11 & 21 : Measurement, data processing and analysis.
Vocabulary
| degree of unsaturation | index of hydrogen deficiency, IHD | molecular ion |
| fragment | wavenumber | fingerprint region |
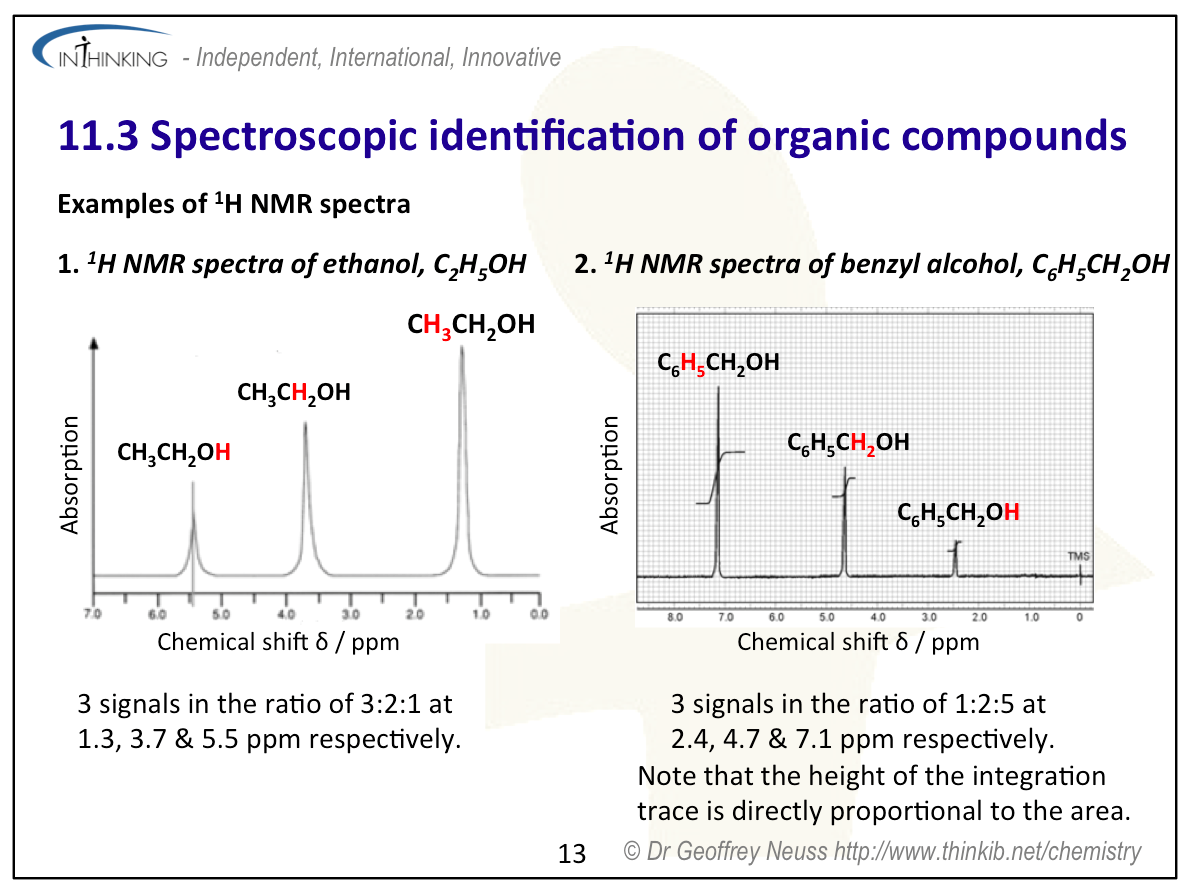
| proton nuclear magnetic resonance spectroscopy,1HNMR | signal | integration trace |
Learning slides
You can use this slide gallery for learning or for reviewing concepts and information. It covers all the key points in the syllabus for this sub-topic.
Spectroscopic identification of organic compounds:
Spectroscopic identification of organic compounds:
Spectroscopic identification of organic compounds:
Spectroscopic identification of organic compounds:
Spectroscopic identification of organic compounds:
Spectroscopic identification of organic compounds:
Spectroscopic identification of organic compounds:
Spectroscopic identification of organic compounds:
Spectroscopic identification of organic compounds:
Spectroscopic identification of organic compounds:
Spectroscopic identification of organic compounds:
Spectroscopic identification of organic compounds:
Spectroscopic identification of organic compounds:
Spectroscopic identification of organic compounds:
Spectroscopic identification of organic compounds:
Spectroscopic identification of organic compounds:
Something to think about
Spectroscopy is relevant to you whether or not you are progressing further with science after you complete your Diploma, as you will often come across references to it throughout your life. These may include newspaper articles on the latest athlete to fail a drug test (below left) or a forensic report in a sensational murder trial or more mundanely when you may have to go into hospital or an MRI scan (below right). If you are going on to university to study a science or a science-based subject modern analytical chemistry features highly in the study of many different disciplines. The knowledge gained in this sub-topic is also used in each of the four options.
The treatment of 1H NMR, IR and mass spectrometry is relatively simple for the diploma programme with the emphasis on their use to elucidate structures. No operating techniques are required for this sub-topic. It does however appeal to your intellect as you can use analysis and derive intellectual satisfaction by solving problems that rely on the data from several different analytical sources. You should also try to look at problems the ‘other way round’ by predicting what the spectra of a particular compound will look like.
Test your understanding of this topic
(Note that your teacher may have restricted your access to some or all of these questions and worked answers if they are going to use them as a class test or set them as an assignment.)
For ten 'quiz' multiple choice questions with the answers explained see MC test: Spectroscopic identification of organic compounds.
For short-answer questions on IHD see Index of hydrogen deficiency questions together with the worked answers on a separate page Index of hydrogen deficiency answers.
For ten short-answer questions on identification of individual compounds from spectral data see Identification from spectra - Question 1, Identification from spectra - Question 2, Identification from spectra - Question 3, Identification from spectra - Question 4, Identification from spectra - Question 5, Identification from spectra - Question 6, Identification from spectra - Question 7, Identification from spectra - Question 8, Identification from spectra - Question 9 and Identification from spectra - Question 10. Each one comes with a model answer that you can access after you have tried the question for yourself.
More resources
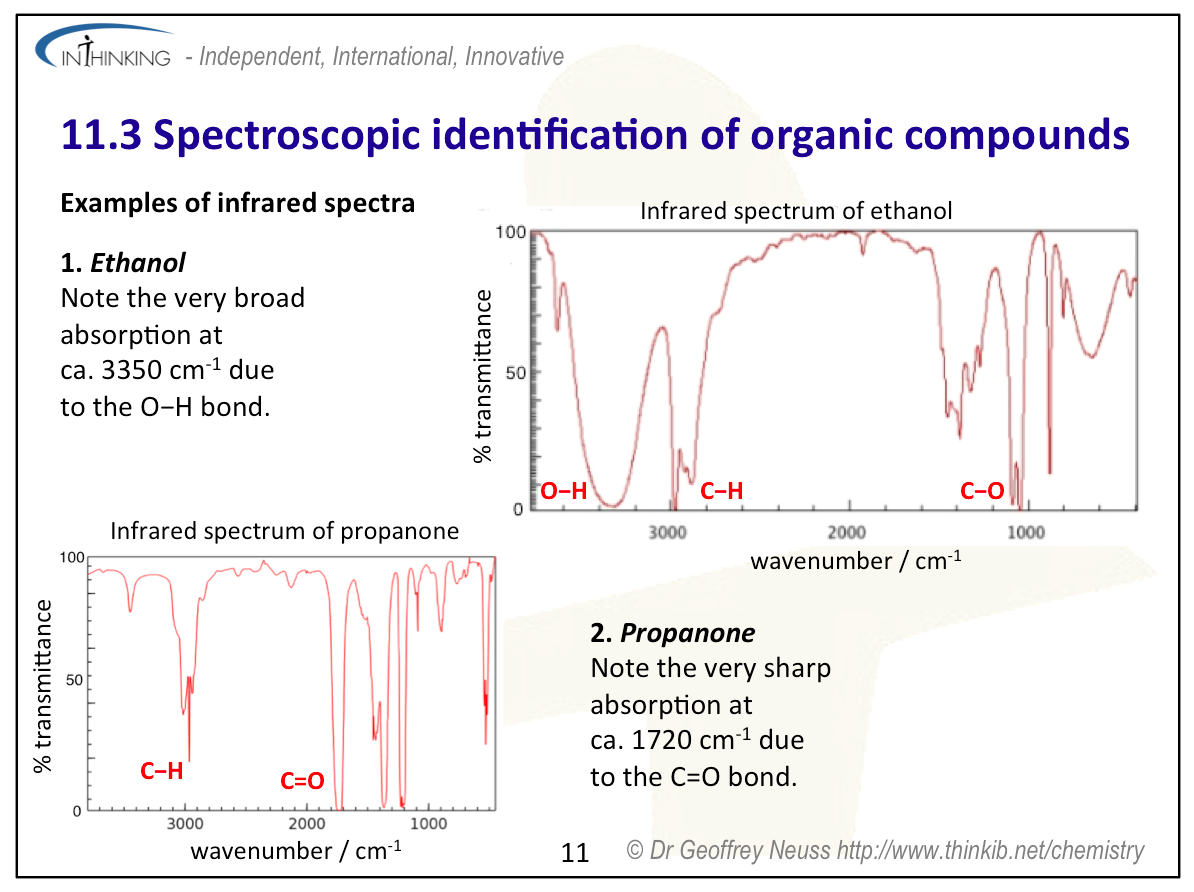
1. Infrared spectrum of ethanol, CH3CH2OH (to show broad -OH absorption and % transmittance and wavenumber axes)
2. Infrared spectrum of butanone, CH3COCH2CH3 (to show a typical carbonyl absorption at about 1720 cm−1)
3. The 1H NMR spectrum of ethanol, CH3CH2OH. Ignore the splitting if you are a Standard Level student. Note that the shift for the -OH proton occurs at 4.8 ppm. Section 27 of the IB data booklet lists it as occurring anywhere between 1.0 and 6.0 ppm..
4. Mass spectrum of ethyl ethanoate, CH3COOC2H5. Note the very small (M+1)+ peak at m/z = 89 due to the presence of 13C. See how many of the fragments you can identify.