21.1 Spectroscopic identification of organic compounds (AHL)
Written specifically for students to provide help and support for the IB Diploma chemistry programme this page provides full coverage of the syllabus content of Topic 21.1 Spectroscopic identification of organic compounds (AHL). It encourages you to think critically and provides many questions with full worked answers so that you can monitor and improve your knowledge and understanding.
 Learning outcomes
After studying this topic you should be able to:
 Understand:
- Identifying the structures of compounds involves a combination of several different analytical techniques. These include IR, 1H NMR and MS.
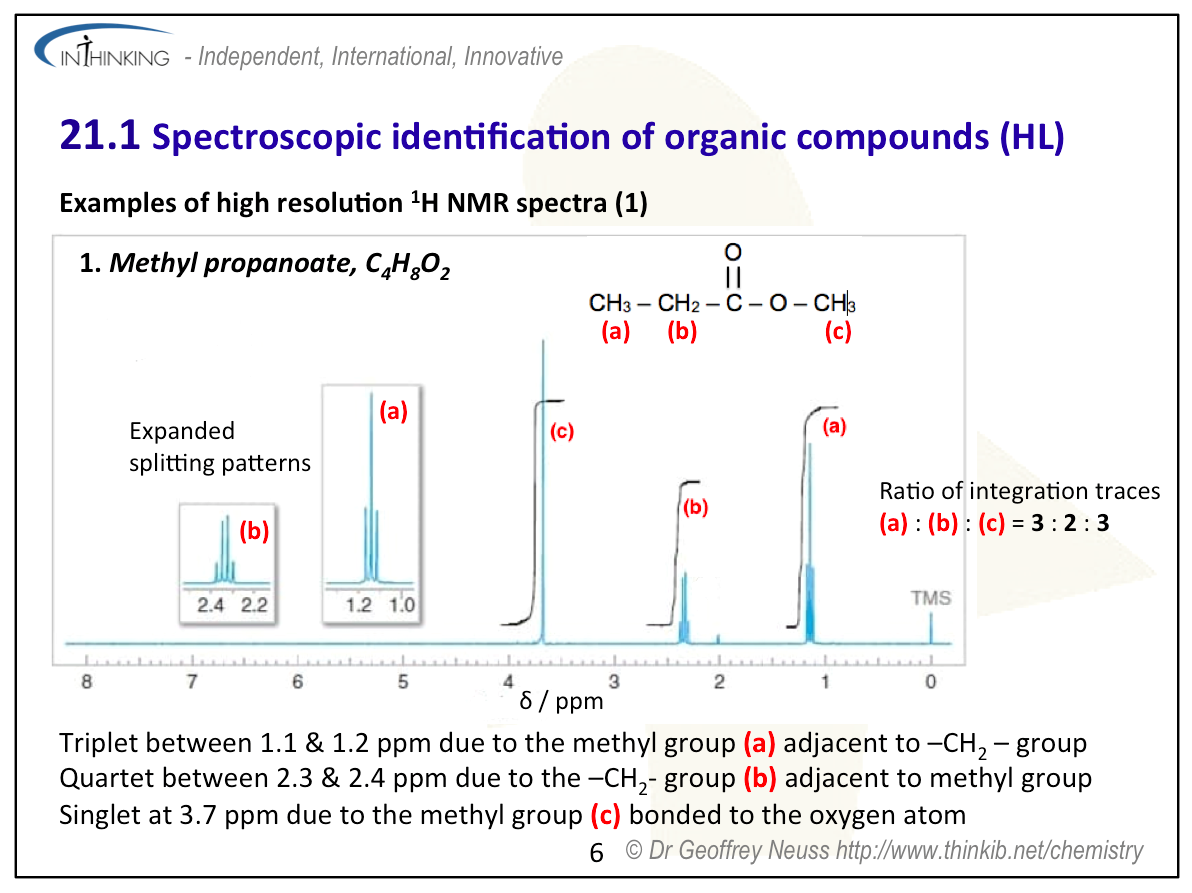
- The single peaks present as the signals in low resolution 1H NMR spectrum can be split into further clusters of peaks at high resolution.
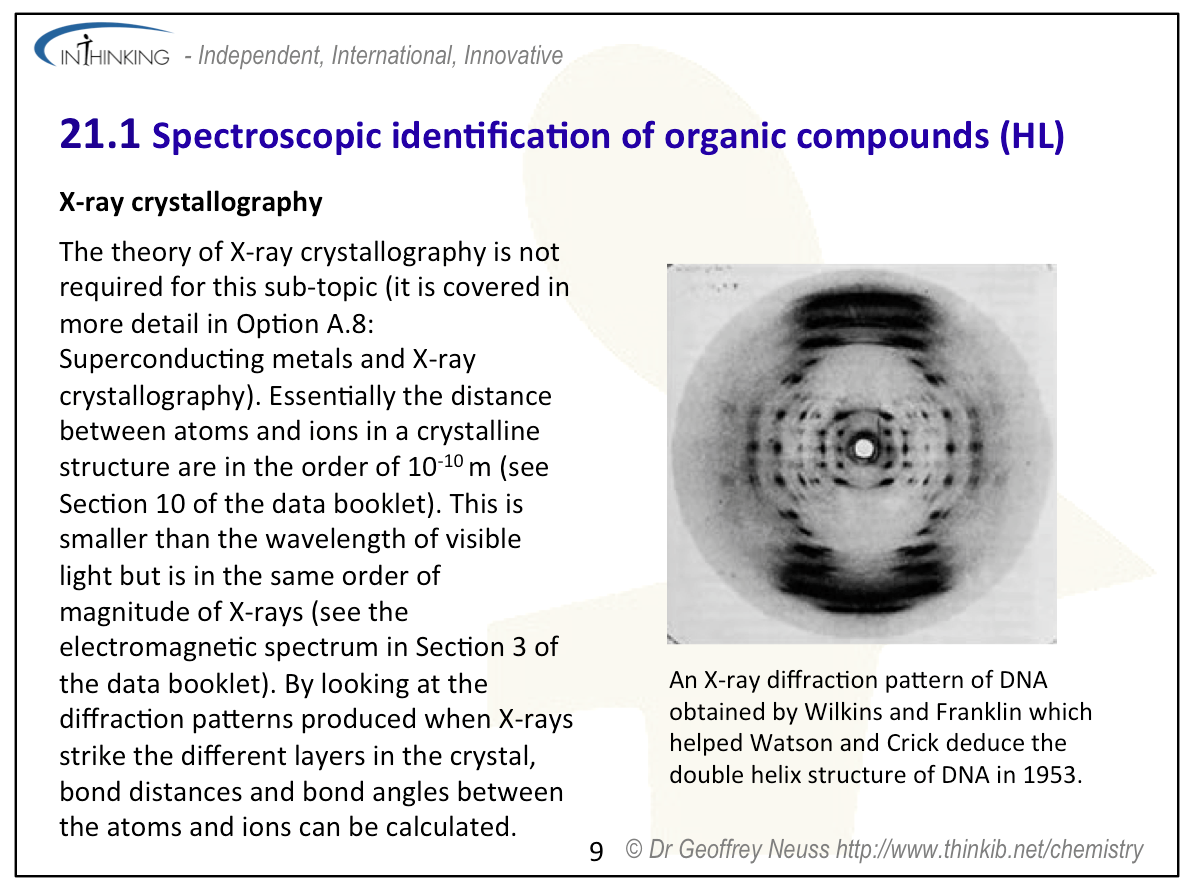
- X-ray crystallography of single crystals can be used to identify the bond lengths and bond angles present between atoms or ions in crystalline compounds.
Apply your knowledge to:
- Explain the use of TMS (tetramethylsilane) as a reference standard.
- Deduce the structure of a compound using data from a range of analytical characterization techniques (X-ray crystallography, IR, 1H NMR and MS).
Relationships & vocabulary
Nature of science
The improvements in modern instrumentation, such as the advances in infrared spectroscopy, 1H NMR spectroscopy and mass spectrometry, have lead to detailed knowledge concerning the structures of compounds.
International-mindedness
Structural information about chemical compounds is shared by chemists internationally. For example, ChemSpider (developed by the Royal Society of Chemistry), The Cambridge Crystallographic Database and the Protein Data Bank (at Brookhaven National Laboratory, USA) exemplify the international nature of the scientific community.
For more examples and links to International mindedness, Theory of knowledge, utilization etc. see separate page which covers all of Topics 11 & 21 : Measurement, data processing and analysis.
Vocabulary
| tetramethylsilane, TMS | low/high resolution | splitting pattern | singlet |
| doublet | triplet | quartet |
Learning slides
You can use this slide gallery for learning or for reviewing concepts and information. It covers all the key points in the syllabus for this sub-topic.
Spectroscopic identification of organic compounds (AHL) :
Spectroscopic identification of organic compounds (AHL) :
Spectroscopic identification of organic compounds (AHL) :
Spectroscopic identification of organic compounds (AHL) :
Spectroscopic identification of organic compounds (AHL) :
Spectroscopic identification of organic compounds (AHL) :
Spectroscopic identification of organic compounds (AHL) :
Spectroscopic identification of organic compounds (AHL) :
Spectroscopic identification of organic compounds (AHL) :
Spectroscopic identification of organic compounds (AHL) :
Something to think about
High resolution 1H NMR, which shows splitting patterns, is an extremely powerful analytical tool.
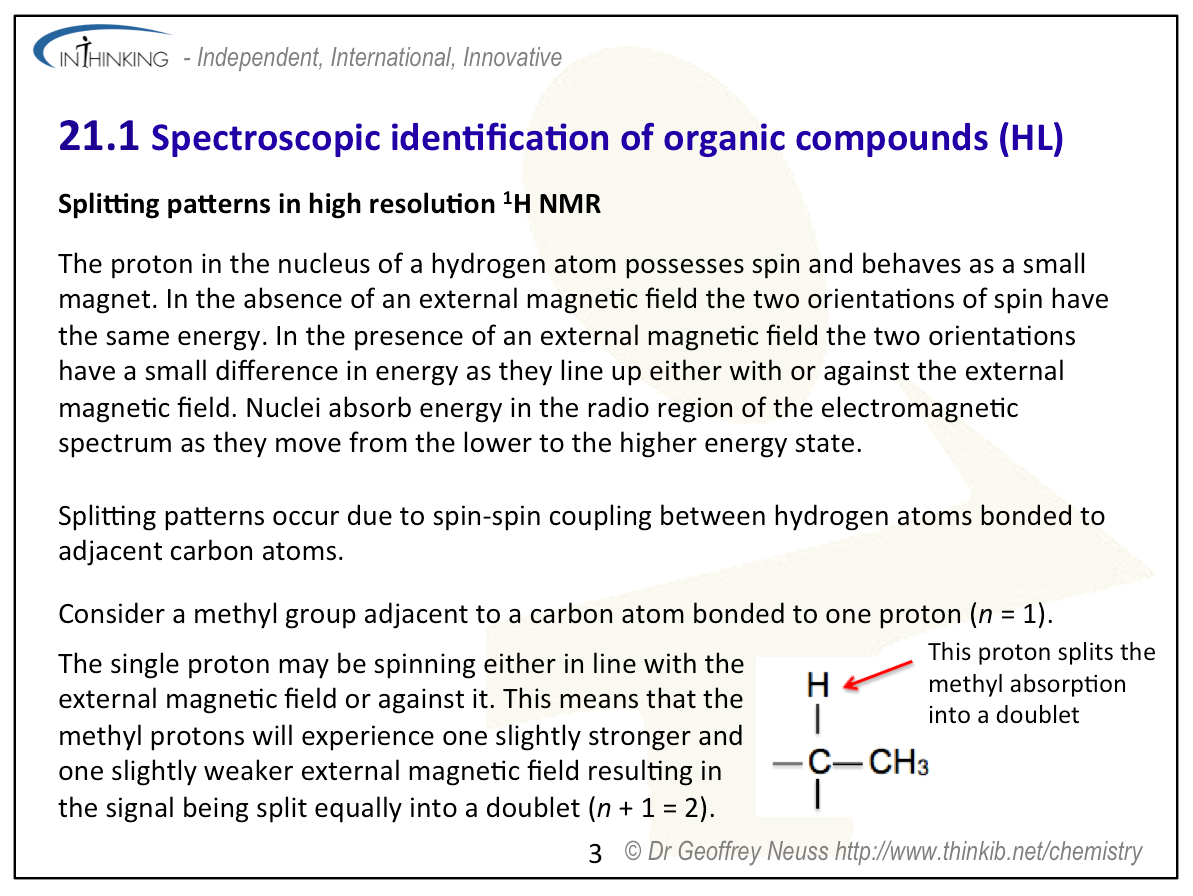
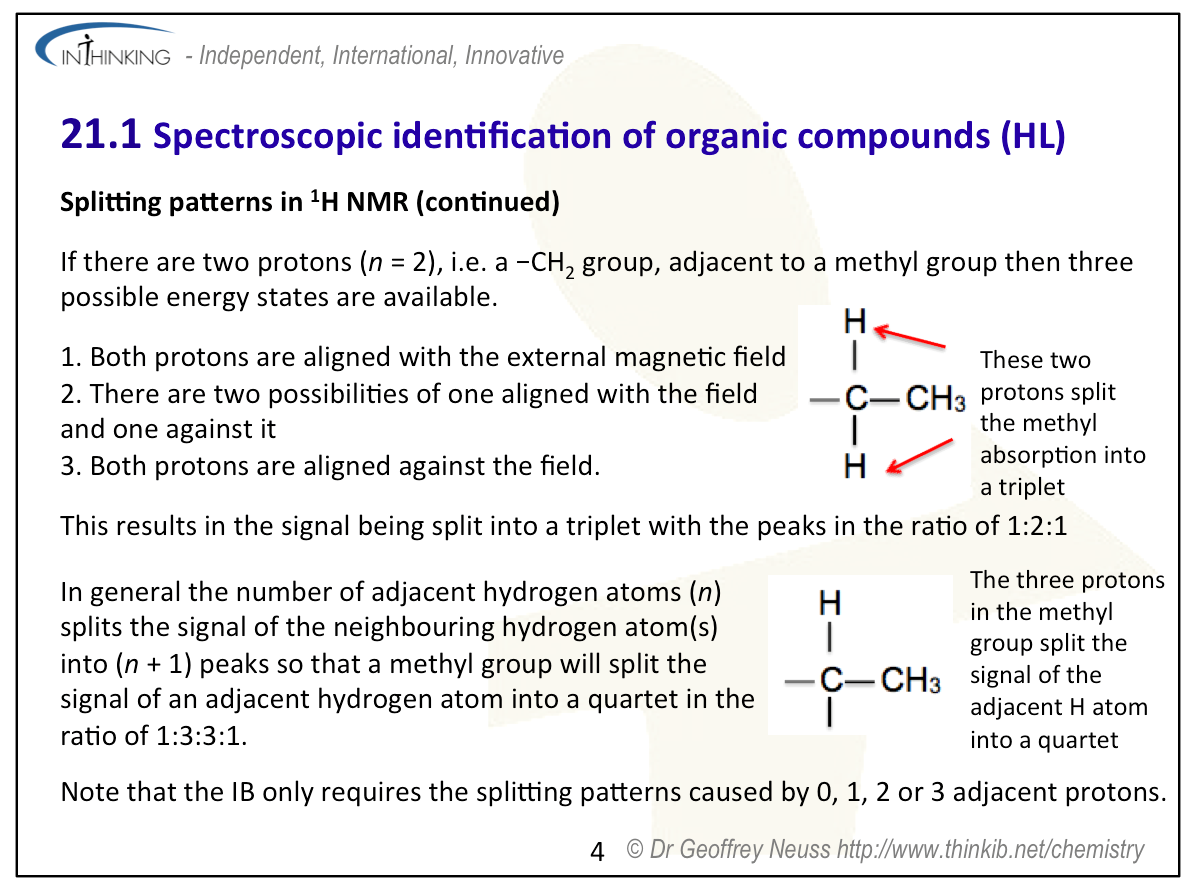
Although you are not required to explain splitting patterns it is worth you having some understanding or how they occur. Consider a methyl group on a carbon atom bonded to another carbon atom that has just one hydrogen atom bonded to it. You should be able to see that the hydrogen atom on the adjacent carbon atom will provide a small magnetic field due to its spin. This will either line up with the applied external magnetic field on the methyl hydrogen atoms or be against it. This means that the methyl hydrogen atoms will see the equivalent of two external magnetic fields, one slightly larger than the other. This will cause the signal to split into a doublet. If there are two atoms on the adjacent carbon atoms then they may both line up with the external field, both line up against it or one line up with it and the other against this effectively cancelling each other out for which there are two possibilities. This effectively produces a 1:2:1 splitting, i.e. a triplet. It is easy for you to predict the splitting pattern from Pascal’s triangle, although you are only expected to know up to a quartet, which means that aromatic ring hydrogen atoms are not generally included.
A neat example to show the importance of splitting patterns is the 1H NMR spectrum of ibuprofen, an over the counter mild analgesic. The structure of ibuprofen is given in Section 37 of the data booklet.
ibuprofen
Work out firstly how many signals you would expect, what the integration trace ratio would be for each signal and then predict the splitting pattern you would expect for each signal.
If you ignore the four hydrogen atoms attached to the aromatic ring (which will give signals in the 7 ppm region) then you should be able to predict that the 1H NMR should show six separate signals with integration trace areas of 6, 2, 1, 3,1 and 1.
The actual spectrum looks like this:
1H NMR spectrum of ibuprofen
The signals at B (integration ration of 4) are due to the aromatic hydrogen atoms. The remaining six peaks are labelled A, C, D, E, F and G and it can be seen that the integration traces give the expected ratios of 1, 1, 2, 1, 3, and 6.
The next diagram shows the splitting patterns that can be seen when the signals are expanded.
From this you should be able to assign each signal to particular hydrogen atoms.
Test your understanding of this topic
(Note that your teacher may have restricted your access to some or all of these questions and worked answers if they are going to use them as a class test or set them as an assignment.)
For ten 'quiz' multiple choice questions with the answers explained see MC test: Spectroscopic identification of organic compounds (AHL).
See interactive questions on 1H NMR including splitting patterns (from Wake Forest University) and the four attached separate questions on identification of organic compounds from spectroscopic data Identification from spectra: Question 7, Identification from spectra: Question 8, Identification from spectra: Question 9 and Identification from spectra: Question 10 together with the worked answers on separate pages Identification from spectra (7) Answer, Identification from spectra (8) Answer, Identification from spectra (9) Answer and Identification from spectra (10) Answer.
More resources
1. A useful video from premed411. It is worth looking at before doing the questions on IHD and combining IR, MS and 1H NMR to identify compounds (ignore the 13C NMR after 5 minutes 10 seconds).
Interpreting spectroscopic data
2. If you enjoy working out splitting patterns this interesting example by John Claude Bradley goes slightly beyond the simple demands of IB as it looks at what happens if the hydrogen atom on an adjacent carbon atom is bonded to a chiral carbon atom.
3. A useful free App for iPhones and iPads (download from itunes) is Chemical Detectives. Ignore the 13C NMR spectra. The 1H NMR has good splitting patterns but no integration traces. Even so, from the analytical, 1H NMR, IR and mass spectra there are many compounds for students to identify. The App is produced by the Chemical Education Association, a group of schools in Victoria, Australia.